

Results 7,811 to 7,820 of 12095
Thread: Anandtech News
-
01-30-18, 08:40 PM #7811
Anandtech: AMD Announces Q4 FY 2017 Results
This afternoon, AMD announced their earnings for the fourth quarter of 2017. AMD ended the 2017 fiscal year on a high note, with earnings that beat their initial estimates. For the quarter, revenues were up 34% from a year ago to $1.48 billion, and AMD was able to maintain the 35% gross margin they achieved last quarter as well, which is right where they need to be for profitability. Operating income for the quarter was $82 million, up from an operating loss of $3 million a year ago. Net income was $61 million, once again compared to a net loss of $51 million a year ago. This resulted in earnings per share of $0.06.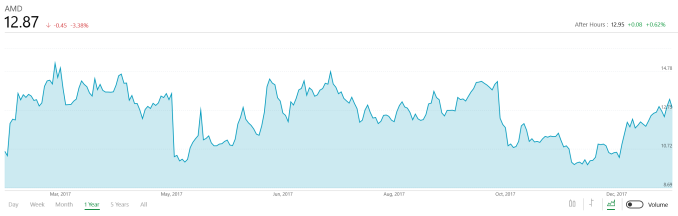
AMD also reports non-GAAP results, which are generally there to show the underlying business performance when they have large write downs, but this quarter AMD’s non-GAAP results closely mirror the GAAP performance, but with no wafer restructuring or other large expenses, the non-GAAP results for this quarter are mainly excluding stock-based compensation, which was $21 million for the quarter. In terms of non-GAAP, operating income was $103 million, net income was $88 million, and earnings per share were $0.08.AMD Q4 2017 Financial Results (GAAP) Q4'2017 Q3'2017 Q4'2016 Revenue $1480M $1643M $1106M Gross Margin 35% 35% 32% Operating Income +$82M +$126M -$3M Net Income +$61M +$71M -$51M Earnings Per Share +$0.06 +$0.07 -$0.06
For the full year, AMD had revenues of $5.53 billion, which was up 25% from 2016, with an overall gross margin of 34%. Operating income for the year was $204 million, compared to an operating loss of $372 million the year before. Net income for the company for the full year was $43 million, compared to a $497 million loss in 2016.
The bulk of the growth from AMD is unsurprisingly from their Computing and Graphics segment, which has seen somewhat of a perfect storm, with the release of the well-received Ryzen CPU lineup this year, along with a cryptocurrency market which is currently absorbing every GPU it can get its hands on. Thanks to new product releases in both the CPU and GPU from AMD, Computing and Graphics had revenue for the quarter of $958 million, which is up 60% from a year ago. This segment had an operating income of $85 million, up from a net loss of $21 million a year ago.
Enterprise, Embedded, and Semi-Custom had segment revenue for the quarter of $522 million, which is up 3% from a year ago, which AMD attributes to server revenue. The segment had an operating income of $19 million, down from $47 million a year ago.AMD Q4 2017 Computing and Graphics Q4'2017 Q3'2017 Q4'2016 Revenue $958M $819M $600M Operating Income +$85M +$70M -$21M
All Other had an operating loss of $22 million, which is an improvement from the $29 million loss in Q4 2016.AMD Q4 2017 Enterprise, Embedded, and Semi-Custom Q4'2017 Q3'2017 Q4'2016 Revenue $522M $824M $506M Operating Income $19M $84M $47M
AMD is expecting revenues of $1.55 billion for Q1 2018, plus or minus $50 million.
2018 looks to be an exciting year for AMD, after their first really successful year in a long time. AMD is expecting to see Ryzen Mobile designs from all the major PC OEMs soon, which should help get it into the hands of more customers (and reviewers!) and the agreement to build a GPU for Intel to integrated on their own CPU is an interesting way to get Radeon into the hands of more people.
Source: AMD Investor Relations
More...
-
01-31-18, 06:51 AM #7812
Anandtech: AMD to Ramp up GPU Production, But RAM a Limiting Factor
One of the more tricky issues revolving around the GPU shortages of the past several months has been the matter of how to address the problem on the GPU supply side of matters. While the crux of the problem has been a massive shift in demand driven by a spike in cryptocurrency prices, demand has also not tapered off like many of us would have hoped. And while I hesitate to define the current situation as the new normal, if demand isn’t going to wane then bringing video card prices back down to reasonable levels is going to require a supply-side solution.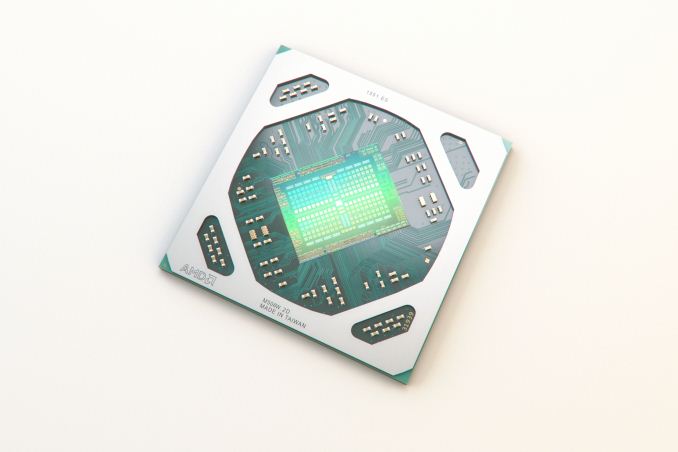
This of course sounds a lot easier than it actually is. Ignoring for the moment that GPU orders take months to process – there are a lot of steps in making a 16nm/14nm FinFET wafer – the bigger risk is that cryptocurrency-induced GPU demand is not stable. Ramping up GPU production means gambling that demand will stay high enough long enough to absorb the additional GPUs, and then not immediately contract and have the market flooded with used video cards. The latter being an important point that AMD got burnt on the last time this happened, when the collapse of the cryptocurrency-prices and the resulting demand for video cards resulted in the market becoming flooded with used Hawaii (290/390 series) cards.
Getting to the heart of matters then, in yesterday’s Q&A session for their Q4’2017 earnings call, an analyst asked AMD about the current GPU supply situation and whether AMD would be ramping up GPU production. The answer, much to my surprise, was yes. But with a catch.
Q: I just had a question on crypto, I mean if I look at the amount of hash compute being added to Ethereum in January I mean it's more than the whole of Q4, so we have seen a big start to the Q1. […] And is there any sort of acute shortages here, I man can your foundry partners do they have the capacity to support you with a ramp of GPUs at the moment and is there enough HBM2 DRAM to source as well?So yes, AMD is ramping up GPU production. Which is a surprising move since they were burnt the last time they did this. At the same time however, while cryptocurrency demand has hit both major GPU manufacturers, AMD has been uniquely hit as they’re a smaller player less able to absorb rapid changes in demand, and, more importantly, their GPUs are better suited for the task. AMD’s tradition of offering more memory bandwidth and more raw FLOPS than NVIDIA at any competing price point, coupled with some meaningful architectural differences, means that their GPUs are in especially high demand by cryptocurrency miners.
A: Relative to just where we are in the market today, for sure the GPU channel is lower than we would like it to be, so we are ramping up our production. At this point we are not limited by silicon per se, so our foundry partners are supplying us, there are shortages in memory and I think that is true across the board, whether you are talking about GDDR5, or you’re talking about high bandwidth memory. We continue to work through that, with our memory partners and that will be certainly one of the key factors as we go through 2018.
But perhaps the more interesting point here isn’t that AMD is increasing their GPU production, but why they can only increase it by so much. According to the company, they’re actually RAM-limited. They can make more GPUs, but they don’t have enough RAM – be it GDDR5 or HBM2 – to equip all of the cards AMD and board partners would like to make.
This is an interesting revelation, as this is the first time memory shortages have been explicitly identified as an issue in this latest run-up. We’ve known that the memory market is extremely tight due to demand – with multiple manufacturers increasing their RAM prices and diverting GDDR5 production over to DDR4 – but only now is that catching up with video card production to the point that current GDDR5 production levels are no longer “enough”. Of course RAM of all types is still in high demand here at the start of 2018, so while memory manufacturers can reallocate some more production back to GDDR5, GPU and board vendors have to fight with both the server and mobile markets, both of which have their own booms in demand going on, and are willing to pay top dollar for the RAM they need.
In a sense the addition of cryptocurrency to the mix of computing workloads has created a perfect storm in an industry that was already dealing with RAM shortages. The RAM market is in the middle of a boom right now – part of its traditional boom/bust cycle – and while it will eventually abate as demand slips and more production gets built, for the moment cryptocurrency mining has just added yet more demand for RAM that isn’t there. Virtually all supply/demand problems can be solved through higher prices – at some point, someone has to give up – but given the trends we’ve seen so far, GPU users are probably the most likely to suffer, as traditionally the GPU market has been built on offering powerful processors paired with plenty of RAM for paltry prices. Put another way, even if the GPU supply situation were resolved tomorrow and there were infinite GPUs for all, RAM prices would be a bottleneck that kept video card prices from coming back down to MSRP.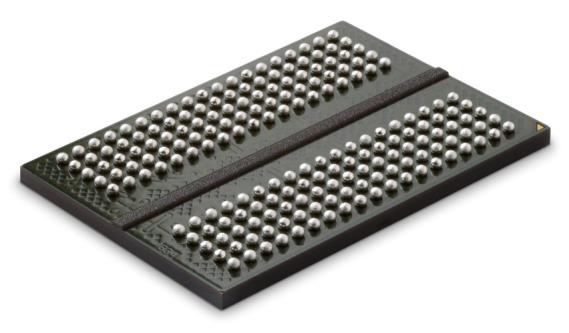
GDDR5: The Key To Digital Gold
With all that said, however, AMD’s brief response in their earnings call has been the only statement of substance they’ve made on the matter. So while the company is (thankfully) ramping up GPU production, they haven’t – and are unlikely to ever – disclose just how many more GPUs that is, or for that matter how much RAM they expect they and partners can get for those new GPUs. So while any additional production will at least help the current situation to some extent, I would caution against getting too hopeful about AMD’s ramp-up bringing the video card shortage to an end.
More...
-
01-31-18, 09:41 AM #7813
Anandtech: The EVGA GeForce GTX 1070 Ti FTW2 Review: iCX Brings the Lights and Sensor
Today, we are taking a look at the EVGA GeForce GTX 1070 Ti FTW2, EVGA's top GTX 1070 Ti model featuring the iCX temperature sensor and cooling system. Launched alongside the GeForce GTX 1070 Ti Founders Edition and other partner boards in November 2017, the EVGA GTX 1070 Ti FTW2 similarly targets the competing Radeon RX Vega 56 with price and performance in between the GeForce GTX 1080 and 1070.
To avoid sales cannibalization, all partner GTX 1070 Ti cards, including the FTW2, adhere to the reference clockspeeds. To differentiate itself, the EVGA GeForce GTX 1070 Ti FTW2 looks to the power, temperature, and noise characteristics due to iCX cooler and adjusted power system, in addition to manual overclocking via a GTX 1070 Ti specific autoscan feature in EVGA's Precision XOC overclock utility. A key piece of the puzzle, pricing, has been unfortunately been subject due to the extraordinarily intense cryptomining demand that has drastically inflated prices and depleted stocks of virtually all graphics cards at the time of publication.
More...
-
01-31-18, 11:01 AM #7814
Anandtech: JEDEC Publishes UFS 3.0 Spec: Up to 2.9 GB/s, Lower Voltage, New Features
JEDEC this week published their UFS 3.0 specification, which is intended to bring numerous performance, power and feature set-related improvements to the standard. The version 3.0 of the spec doubles the per-lane performance of an eUFS device to 11.6 Gbps, which increases the peak data transfer rate of a storage device to 23.2 Gbps. At the same time, the new standard introduces a 2.5 V VCC power supply mode that enables lower power consumption and support for the latest types of NAND. Finally, the UFS 3.0 spec contains features designed specifically for automotive applications that enable standard support for extended temperature ranges as well as “refresh” operation to boost reliability.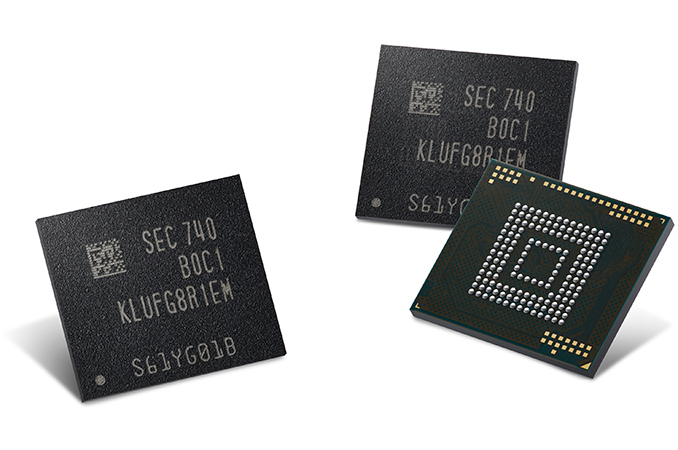
One of the key improvements of the UFS 3.0 (JESD220D) specification is the usage of MIPI's M-PHY 4.1 physical layer as well as the recently released MIPI UniPro 1.8 protocol to form the interconnect layer (IL). The new IL supports data rates of up to 11.6 Gbps (HS-Gear4) per lane as well as QoS features to enable a more reliable link through monitoring and training of the communication channel. All UFS 3.0-compatible devices are required to support HS-G4 (11.6 Gbps) and HS-G4 (5.8 Gbps), which means that they all will be faster than UFS 2.0/2.1-compliant devices that do not necessarily support HS-G3. UFS 3.0 storage devices will continue to feature up to two full-duplex lanes, which means a theoretical maximum bandwidth of up to 23.2 Gbps (2.9 GB/s) when HS-G4 is used. The MIPI M-PHY 4.1 standard continues to use 8b10b line encoding, so accounting for the encoding overhead, the actual achievable bandwidth by an embedded UFS device will be considerably lower than the theoretical one — 15 Gbps (1.875 GB/s) is something that is reasonable to expect.
The upcoming eUFS 3.0 storage devices will require three different power rails: 1.2 V for VCCQ, 1.8 V for VCCQ2, as well as 2.5 V/3.3 V for VCC. The addition of 2.5 V for VCC is to enable support for the latest and upcoming generations of NAND flash with higher bit densities (including 3D NAND with higher amounts of layers as well as 3D TLC NAND).
The UFS 3.0 standard also supports a number of features particularly suitable for the automotive industry. UFS 3.0 devices may support a native predefined low/high temperature event notification which will simplify development of UFS-based automotive applications. Extended temperature ranges (-40°C, 105°C) will be optionally supported by host controllers. Furthermore, the latter might also adopt a standard “refresh” function to extend data retention by moving data from cell to cell to keep charges at sufficient levels.
Another important innovation of the UFS 3.0 spec is enhanced support for RPMBs (replay protected memory block). The new standard supports multiple RPMBs with multiple RPMB keys. Furthermore, RPMB regions can now be configured at manufacturing, simplifying their usage for device makers.
To simplify development of UFS-based applications going forward, JEDEC also released JESD223D — a functional specification of a UFS host controller interface (UFSHCI). This spec defines features and registers that have to be supported by UFS 3.0 host controllers and enable usage of a standard driver for all applications featuring UFS 3.0-compatible storage devices.
The UFS 3.0 standard greatly speeds up performance and capacity of storage subsystems inside smartphones, tablets, media players, VR headsets, automotive and other applications that are going to use it. Meanwhile, it is not clear when this might happen. There is at least one company who has been offering UFS 3.0 controllers since Q2 2017, but it looks like the latest mobile SoCs from Qualcomm, HiSilicon, MediaTek and Samsung do not support the new spec. That said, expect applications based on the new standard to be released in the coming years, just not in 2018.
Related Reading:
- Toshiba Samples eUFS Devices for Vehicles: Extended Temps & Reliability Features
- Samsung Starts Production of 512 GB UFS NAND Flash Memory: 64-Layer V-NAND, 860 MB/s Reads
- Toshiba Samples New UFS 2.1 NAND: Up to 900 MB/s Reads For 2018 Smartphones
- Samsung Rolls Out Its First UFS Cards: SSD Performance in Card Form-Factor
- Samsung Announces 256GB UFS Embedded Storage Solution
- Samsung Announces 128GB UFS Storage For Smartphones
More...
-
01-31-18, 01:56 PM #7815
Anandtech: TSMC Starts to Build Fab 18: 5 nm, Volume Production in Early 2020
TSMC last week held a groundbreaking ceremony for its Fab 18 phase 1 production facility. The fab will produce chips using TSMC’s 5 nm process starting from early 2020. When all three phases of the manufacturing facility are completed, its wafer starts capacity will exceed one million 300-mm wafers per year, comparable with other three GigaFabs operated by TSMC.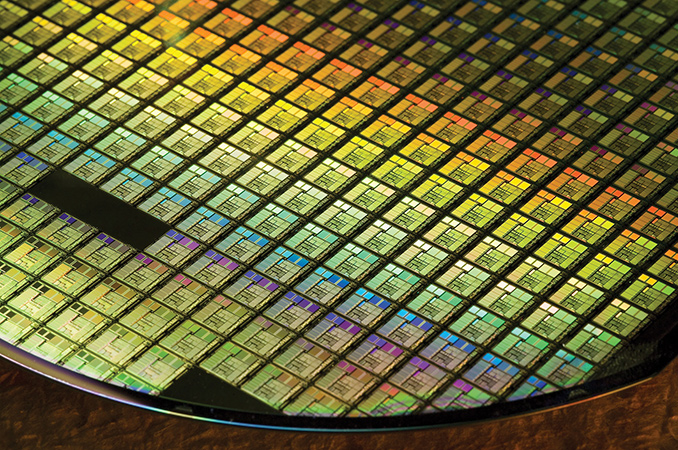
TSMC’s Fab 18 will be located in Tainan (in the Southern Taiwan Science Park), and will be built in three phases. The construction of the first phase or segment of the building will be completed in about a year from now, after which TSMC will move in equipment sometime in early 2019. In about two years from now, the company expects to start volume production of chips using its 5 nm process technology at the Fab 18/phase 1. Construction of the second and the third phases will commence in Q3 2018 and Q3 2019. The two phases will start volume production in 2020 and 2021, respectively.
The Fab 18 will have a total floor area of 950,000 square meters and its cleanroom area will exceed 160,000 square meters, the contract maker of semiconductors said. TSMC estimates that the combined production capacity of all three phases of the Fab 18 will exceed one million 300-mm wafer starts per year, which is comparable to the capacities of the other GigaFabs that TSMC operates — Fab 12, Fab 14, and Fab 15. It is noteworthy that the planned floor area and cleanroom space of the Fab 18 will be significantly larger than the initially planned floor and cleanroom area of the Fab 15, which emphasizes increasing complexity of IC manufacturing these days as well as increasing orders from TSMC's clients. In total, the Fab 18 will cost TSMC NT$500 billion ($17.08 billion), making it one of the most expensive chip manufacturing facilities in the world.TSMC's Fab 18: Milestones Phase 1 Phase 2 Phase 3 Construction Start Early 2018 Q3 2018 Q3 2019 Equipment Move-In Early 2019 ? ? High-Volume Manufacturing Start Early 2020 2020 2021
Besides its dimensions and cost, there is another reason why Fab 18 is important for the semiconductor industry: it will be one of the world’s first facilities to produce chips using a 5-nm production tech. TSMC yet has to detail its 5 nm manufacturing technology, but from the announcements that the company has made so far it is evident that this fabrication process will rely significantly on EUV lithography. TSMC did not mention EUV at all in its press release, which is a bit strange. Meanwhile, over the course of last year the semiconductor manufacturer did mention that the 5 nm fabrication technology would be its second-gen EUV process, which means usage of EUV for more more layers when compared to the CLN7FF+ (its advanced 7 nm tech). Furthermore, TSMC already has functional SRAM cells made using its CLN5FF technology and the yields were satisfactory in mid-2017. Therefore, the 5 nm development process seems to be going on relatively well.Brief Comparison of TSMC's Fab 15 and Fab 18 Fab 15 Fab 18 Total Area of Site 18.4 hectares ? Building Area 430,000 m² 950,000 m² Clean Room Space* 104,000 m² 160,000 m² Initially Expected Investment** NT$300 billion
~$9.375 billionNT$500 billion
~$17.08 billionGroundbreaking July 2010 January 2018 Notes *Fabs are usually upgraded over time, today's cleanroom space of the Fab 15 may be larger than initially projected.
**Initially expected investments tend to change over time.
The extended usage of EUV for 5-nm chip production means that the company will need to install more EUV tools into the Fab 18, which is one of the reasons why it needed to expand the fab’s cleanroom space. The fact that TSMC has begun to build Fab 18 indicates that the contract maker of chips is confident in its 5 nm technology as well as EUV equipment, including ASML’s TWINSCAN NXE scanners, Cymer’s EUV light sources and other tools. This confidence is further underscored by their intention to start high-volume manufacturing of 5-nm devices in Fab 18 in early 2020.
Related Reading:Advertised PPA Improvements of TSMC's CLN7FF Nodes
Data announced by TSMC during conference calls, press briefings and in press releases7FF
vs
16FF+7FF
vs
10FF7FF EUV
vs
7FF5FF EUV
vs
7FF EUVPower 60% 37% ~10-15-20% tangible HVM Start ~Q2 2018 - ~H2 2019 H1 2020
- Samsung and TSMC Roadmaps: 8 and 6 nm Added, Looking at 22ULP and 12FFC
- TSMC Teams Up with ARM and Cadence to Build 7nm Data Center Test Chips in Q1 2018
- EUV Lithography Makes Good Progress, Still Not Ready for Prime Time
Sources: TSMC (1, 2, 3, 4)
More...
-
01-31-18, 03:18 PM #7816
Anandtech: MSI Announces Immerse GH60 Gaming Headset, Vigor GK40 Keyboard and Vigor
MSI this week has announced two new products to add to its gaming peripherals lineup: the Immerse GH60 Gaming Headset, as well as new Vigor GK40 keyboard. Along with that, they have paired the new Vigor Keyboard and existing Clutch GM10 Gaming Mouse together for ease of purchase. MSI’s aim with the new products and combo is to provide more options for the mainstream gamers and include complimentary parts from their product stack into a one-stop solution for a gaming mouse and keyboard.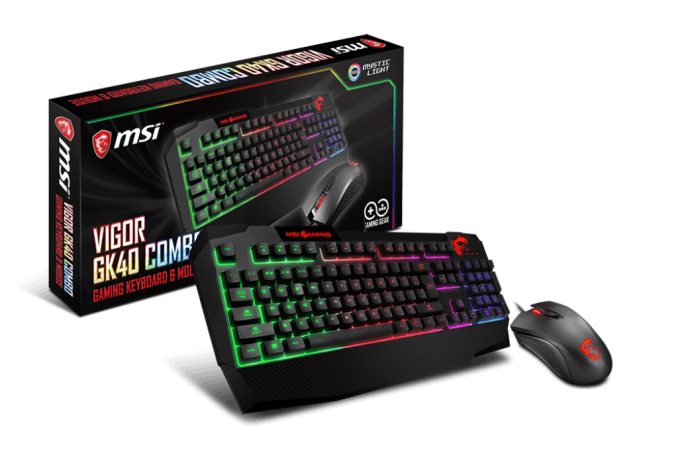
GH60 Gaming Headset
The Immerse GH60 Gaming Headset is an over the ear type using a solid stainless steel design and flexible suspension headband that is intended to fit many head sizes and have a comfortable fit. Its ear cups swivel for comfort as well as easy carry and storage capabilities. The ear pads are swappable and MSI includes a set of cloth ear cups as well so users are able to choose their preference. Outside of the steel framing, the suspension headband, ear cups, and other structures are black with the familiar MSI Gaming dragon in red on the outside of both ear cups. A gaming headset wouldn’t be complete without a microphone and while it is permanently attached it is retractable and can hide inside the unit when not in use.
Specs wise, the GH60 uses a single 50mm Neodymium driver in each ear cup and yields a frequency response of 20 Hz ~ 40 kHz with an impedance of 32 Ohm. The unidirectional microphone is able to capture frequencies from 100 Hz ~ 10 kHz. Connecting the GH60 to a PC is a 2M braided cable to with a gold plated 3.5” headphone jack at the end. Inline is a remote control offering volume control and muting the microphone.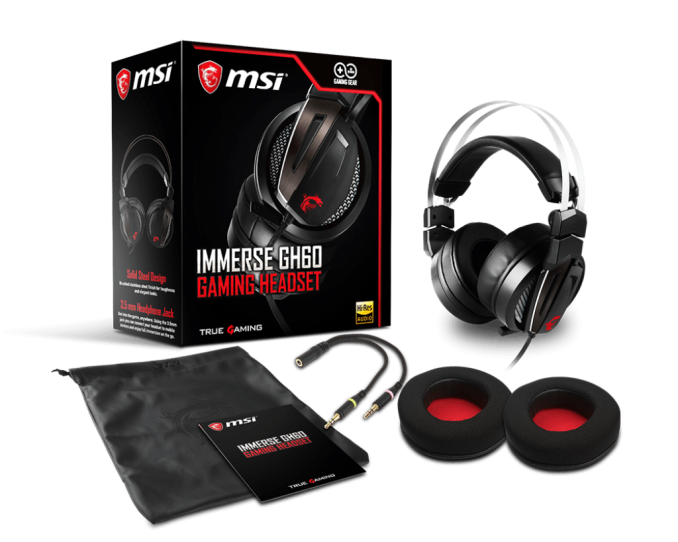
MSI did not mention the price but it will be available January 2018.
Vigor GK40 and GK40 Combo with Clutch GM10 Gaming MouseImmerse GH60 Gaming Headset Connector 3.5mm headphone jack Cable Gold Plated and Braided / 2M Length / Low Resistance Driver 50mm Neodymium Speaker Sensitivity (SPL) 96 dB ± 3 dB Speaker Impedance 32 Ω Speaker Frequency Response 20 Hz ~ 40 kHz Pick-Up Pattern Unidirectional Microphone Frequency Response 100 Hz ~ 10kHz Microphone Sensitivity -40 dB ± 3 dB Microphone Impedance 2.2k Ω
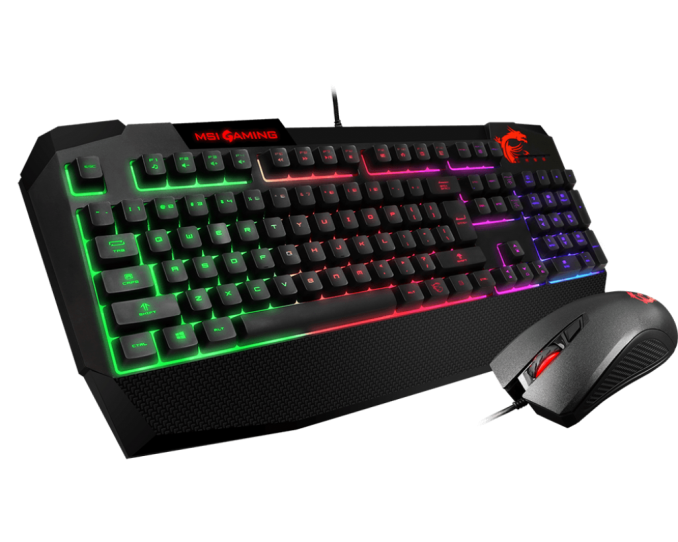
MSI has also launched the new Vigor GK40 Gaming Keyboard that features ‘mechanical-like’ keystrokes from a membrane-based keyboard. The GK40 is a full sized keyboard including a number pad and a large palm rest for comfortable gaming. The keys have anti-ghosting capability with up to 20 keys for a conflict-free gaming experience. The keyboard is also water repellant hopefully preventing damage from the inevitable spill on the keyboard. It has multi-color backlit keys with four levels of brightness adjustment, and eight different light effects across six regions which can all be controlled through their Mystic Light application.
The GM10 Gaming Mouse is an unassuming device by mouse standards is a four-button device with a web wheel and on-the-fly DPI adjustment buttons along with the two standard. It has an asymmetric design and dragon scale anti-slip grip is made for right-handed users, though it looks like a lefty could be OK with it as the design doesn’t look too asymmetric and awkward.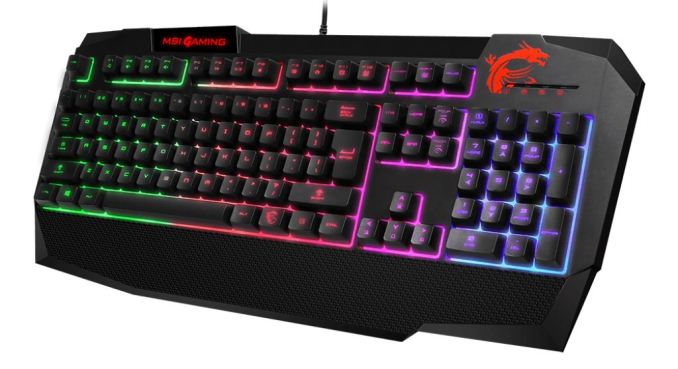
The Pixart ADSN-5712 optical sensor has four built-in instant DPI settings, 800/1000(default)/1600/2400, which can be set without software. While the main key switches are not listed but are said to provide 10 Million+ clicks. The integrated LEDs are found in the web wheel (up to four colors) and the Red Dragon. The Dragon logo has a breathing effect while the web wheel color matches the DPI (blue, red, green, and purple). The GM10 connects to the PC via a 1.8m USB cable.
MSI has grouped the GK40 keyboard and GM10 mouse into one package in order to simplify the purchase of a gaming keyboard and mouse. The packaging will show Vigor GK40 Combo on it as well as picture the mouse to discern itself from just the keyboard package itself which looks remarkably similar.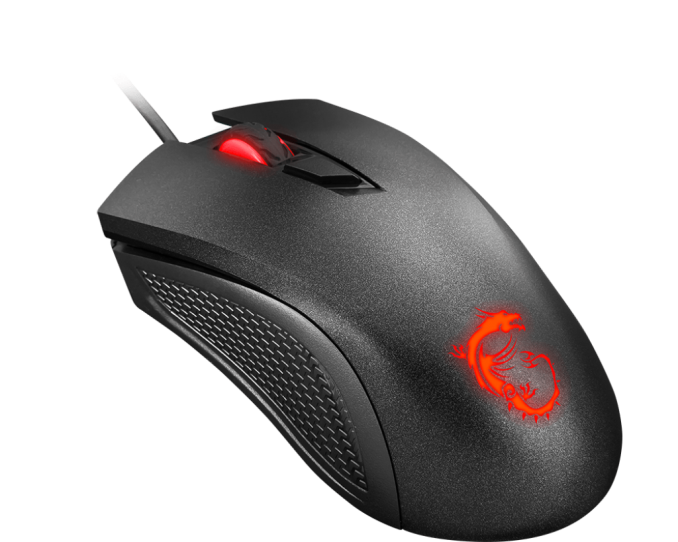
No mention of pricing but these I'd expect the combo to be relatively inexpensive since it is geared towards the mainstream and isn't a mechanical keyboard or fancy RGB multi-button mouse. These are also said to be available in January.
 Gallery: MSI GK40 / GM10 / GH40 Gallery
Vigor GK40 Keyboard Model Vigor GK40 Gaming Keyboard Main Key Switches Membrane switches (Mechanical-like) Keyboard Interface USB Normal Keys Stand 104 keys / 105 keys / 108 keys Dimensions (mm) 472 x 207 x 39 Windows Support / Requirements Windows 10 / 8.1 / 8 / 7 - System with USB Support Backlight 6-region RGB illumination, supports MSI Mystic Light Weight 1056g Clutch GM10 Gaming Mouse Sensor PixArt ADSN-5712 Sensor Type Optical DPI Switch 800 / 1000 (default) / 1600 / 2400 Color Black Buttons 4 Response Time 1ms Main Key Switches 10 Million+ clicks LED Light Red Dragon LED / Wheel (four colors) Lighting Effects Logo LED: Breathing effect
Wheel LED: by DPI (800 Blue / 1000 Red / 1600 Green / 2400 Purple)Cable / Interface 1.8m / USB Dimensions (mm) / Weight (G) 125 x 64 x 42 / 104g Operating System Windows 10 / 8.1 / 8 / 7 / Vista / XP 


Related Reading:- Tesoro Returns with Low-Profile Switch Keyboards, Fresh Software
- Cooler Master at CES 2018: Aimpad's Analog Keyboard Technology Found in Cooler Master MK851
- Corsair at CES 2018: Wireless k63 Mechanical Keyboard with Accompanying Lap Board
- ASUS at CES 2018: Rog Strix Flare Keyboard and the ROG Spotlight Lights Up Vegas
- Thermaltake Launches Tt eSports Iris Optical RGB Gaming Mouse
- Razer Reveals Mamba HyperFlux Mouse: No Battery, Wireless Charging
More...
-
01-31-18, 10:17 PM #7817
Anandtech: Microsoft Announces Q2 FY 2018 Earnings
This afternoon, Microsoft announced their earnings for the second quarter of their 2018 fiscal year. The company had revenues of $28.9 billion for the quarter, which is up 12% from a year ago, and was driven by strong growth in their business offerings and cloud revenue. Gross margin for the quarter was 62%, which is flat compared to Q2 2017. Operating income was $8.7 billion for the quarter, which was up 10% year-over-year, but Microsoft is taking a $13.8 billion charge on deemed repatriation of deferred foreign income, so for this quarter, in terms of GAAP results, they are reporting a net loss of $6.3 billion, which results in a loss per share of $0.82. Excluding that charge, net income would have been up 20% to $7.5 billion.
Microsoft’s More Personal Computing (MPC) division is not the star of the show anymore, but it still brings in the more revenue than the company’s other divisions. For the quarter, MPC had revenues up 2% to $12.17 billion, with the growth attributed to gaming and search, although further losses from their failed phone efforts accounted for 2% of revenue loss. The MPC segment had $2.51 billion in operating income for the quarter, which was down 2% from a year ago. Margins for Surface and search were up, but gaming was down due to the expenses related to the launch of the Xbox One X.Microsoft Q2 2018 Financial Results (GAAP) Q2'2018 Q1'2018 Q2'2017 Revenue (in Billions USD) $28.918 $24.538 $25.826 Operating Income (in Billions USD) $8.679 $7.708 $7.905 Gross Margin (in Billions USD) $17.854 $16.260 $15.925 Margins 61.7% 66.3% 61.7% Net Income (in Billions USD) -$6.302 $6.576 $6.267 Basic Earnings per Share (in USD) -$0.82 $0.85 $0.81
Windows OEM Pro revenue was up 11% for the quarter, which Microsoft stated is a couple percentage points ahead of the commercial PC market, which indicates that there’s some growth on the commercial side right now in terms of PC sales. OEM non-Pro declined 5% though, which is a larger decline than the personal PC market. Search revenue was up 15% for the quarter, with both more revenue per-search, and more search volume.
On the gaming side, revenue was up 8% to $3.92 billion, with Xbox hardware revenue up 14% from the launch of the Xbox One X. Xbox software and services grew 4%, with more digital sales in the picture. Microsoft no longer reports Xbox console sales numbers, but they did state that active users of Xbox Live has grown 7% to 59 million, but that’s across their ecosystem and not specific to the console hardware.
Surface didn’t have spectacular quarter though, with revenue basically flat year-over-year at $1.335 billion. Microsoft’s average selling price was up, but there was a decline in unit sales compared to the same point last year, which is a bit surprising since the company has refreshed it’s product lineup this year, where as a year ago it was still the same devices as launched in November 2015.
Productivity and Business Processes, which includes Office 365, commercial, and consumer, along with Dynamics, and LinkedIn, continues to show strong growth for the company. For this quarter, revenues were up 25% to $8.95 billion. LinkedIn accounted for 15 percentage points of revenue growth for this segment. Operating income was up 9% to $3.34 billion. Office 365 continues to be a huge success, although it’s certainly cannibalizing some of Microsoft’s old business. Office 365 commercial seats were up 30% for the quarter, compared to Q2 2017, and revenue from commercial seats was up 41%. However, the traditional Office sales declined 16% due to this growth in the subscription model. On the consumer side, Office consumer revenue was up 12%, and they now have 29.2 million subscribers. Dynamics revenue was up 10%, with Dynamics 365 up 67%. LinkedIn contributed revenues of $1.3 billion, although that acquisition is also responsible for 33% of their expenses for this segment.
Intelligent Cloud, which includes server and cloud products, as well as enterprise services, had revenues for the quarter of $7.8 billion, which is up 15% from a year ago. Operating income was $2.83 billion, up 24%. Server products continued to grow, up 4% from a year ago, but Azure is the key to this segment, with Azure revenue up 98% from a year ago, which continues a trend of 90+% revenue growth for the last five quarters. Azure compute usage more than doubled over the last year.
Despite a large charge for taxes this quarter, it’s clear that Microsoft’s cloud efforts are starting to really pay dividends. For Q3, Microsoft is expecting revenues in the $25.25 to $25.95 billion range.Microsoft Q2 2018 Financial Results (GAAP) Productivity and Business Processes Intelligent Cloud More Personal Computing Revenue (in Billions USD) $8.95 $7.80 $12.17 Operating Income (in Billions USD) $3.34 $2.83 $2.51 Revenue Change YoY +25%, +24% CC +15%, +15% CC +2%, +2% CC Operating Income Change YoY +9%, +10% CC +24%, +24% CC -2%, -2% CC
Source: Microsoft Investor Relations
More...
-
02-01-18, 09:05 AM #7818
Anandtech: Plextor Launches M8V SATA SSD
Plextor has introduced the M8V series, their latest budget SATA SSDs, now with 64-layer 3D TLC NAND. Plextor's budget SATA drives tends to use whatever controller and NAND combination makes the most sense at the time—they aren't limited to reference designs from the controller vendors, and instead Plextor and parent company Lite-On design their own drives and controller firmware. For this iteration, Plextor has chosen the Silicon Motion SM2258 controller and Toshiba's 64L 3D TLC NAND flash. Last time around with the M7V it was Toshiba 15nm planar TLC and a Marvell controller, and the preceding M6V used Toshiba 15nm MLC with the Silicon Motion SM2246EN controller. Silicon Motion's controllers have mostly been used with Intel/Micron 3D NAND recently, so the M8V will provide an interesting opportunity for comparison between two competing 3D NAND designs paired with the same controller.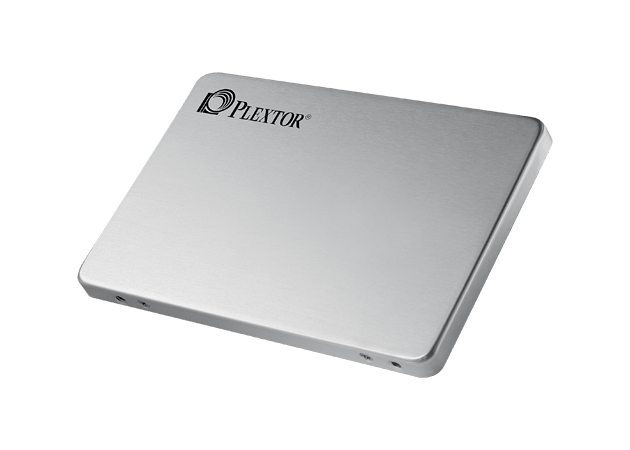
In this product segment, Plextor is still sticking with capacities ranging from 128GB to 512GB and three year warranties. Write endurance is rated at a reasonable 0.5 drive writes per day, giving the M8V a total write endurance rating on par with most consumer SSDs that have five year warranties but are rated for only 0.3 DWPD. The M8V is available as a 2.5" drive with the model number M8VC, or as a M.2 SATA drive with model number M8VG.Plextor M8V Specifications Capacity 128 GB 256 GB 512 GB Form Factor 2.5" SATA and M.2 2280 SATA Controller Silicon Motion SM2258 NAND Toshiba 64-layer 3D TLC Sequential Read up to 560 MB/s up to 560 MB/s up to 560 MB/s Sequential Write up to 400 MB/s up to 510 MB/s up to 520 MB/s 4KB Random Read up to 60k IOPS up to 81k IOPS up to 82k IOPS 4KB Random Write up to 70k IOPS up to 80k IOPS up to 81k IOPS Endurance 70 TBW 140 TBW 280 TBW Warranty 3 years
Our 512GB sample just arrived and will take its turn on our SSD testbed soon.
More...
-
02-01-18, 11:27 AM #7819
Anandtech: Skylake-D Creeps Out on Intels Price List
News about the next update on Intel’s Xeon-D line has been thin. For over a year now, we were expecting to hear what plans were in store for one of the more esoteric Intel SoC lines: the first generation parts were based on Broadwell, had up to sixteen cores, and supported both ECC memory up to 128GB and 10GBase-T on a single bit of silicon for under 45W. When it came out, it was amazing all this was on a single chip, compared to the quad-core parts in the consumer market. Xeon D ended up having a lot of uses for networking, storage, management, and dense server installations. How and when Intel would be updating this product line has been somewhat of a mystery.
Based on a few slide presentations from Intel however, we had been expecting something new to come in 2018, with Intel expecting to use Skylake-SP cores (ones with AVX512 support). Having poked and prodded Intel, we were expecting to be involved in any media communications about the platform, but it seems like the managers behind Intel’s Price List have jumped the gun a bit.
Intel’s price list is used by its customers (OEMs, system integrators) to identify the tray cost of its processors. Intel defines a tray as 1000 units with an OEM-style warranty, and the price is per unit. Historically this document has been updated weekly, however due to leaks (not unlike this one) in 2017, Intel has moved to a monthly update cycle. We had been expecting a mid-January refresh of the document, but that did not happen until the very last day of January, and we get these three processors listed.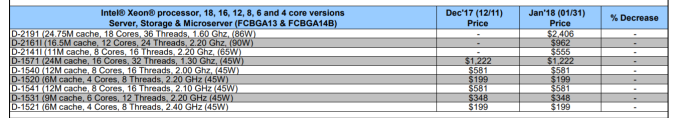
The top of the stack is the Xeon D-2191, an 18-core processor with hyperthreading, running at a 1.60 GHz base frequency for a TDP of 86W. Without any extra information about the SoC itself, such as memory support or added features/controllers, it is hard to say if this is any better than what the previous generation offered: the Xeon D-1571 for example, is a 16-core part with hyperthreading and only 300 MHz less on the base frequency, for almost half the TDP. It could be construed that this value will include the AVX512 units in action, however TDP is usually quoted as the base frequency without AVX instructions in flight.Intel Xeon D 2018 Cores/
ThreadsBase
FrequencyL3 Cache TDP Price Xeon D-2191 18 / 36 1.60 GHz 24.75 MB 86 W $2406 Xeon D-2161I 12 / 24 2.20 GHz 16.50 MB 90 W $962 Xeon D-2141I 8 / 16 2.20 GHz 11.00 MB 65 W $555
Also given in the list is the Xeon D-2161I. That’s a capital I on the end of that SKU name, which is a new addition to Intel’s product suffixes. It adds in additional problems, speaking as an individual whose name starts with the letter I, because I often get packages from China addressed to ‘Lan’. A capital i and a lower case L, in a font without serifs, is not without its problems. Unless this price list is using a lower case L. Looking at who writes the list, apparently distinguishing between Ghz and GHz isn't a priority either.
But this SKU is a 12-core part, at higher frequency at 2.20 GHz, but 90W total. We can compare this to the D-1531, a 6-core part at 2.20 GHz, but 45W TDP: so the newer hardware is double the cores and double the TDP – again without knowing what else is in the silicon, this seems like a specific scaling and not so much of an efficiency increase. It would be interesting to see the die-size comparison.
The last SKU is the D-2141I, coming in at eight cores with hyperthreading, 2.20 GHz base frequency at 65W. This is likely a harvested part to keep die yields high.
Out of the price list, nothing tells us that these are Skylake-D parts. What does tells us this is an update to Supermicro’s product list. Recently SM has announced two new motherboards in its motherboard matrix grid, called the X11SDV-8C-TLN2G and X11SDV-4C-TLN2F. These are mini-ITX motherboards with Skylake-D SoCs already integrated, and come with support for 512GB of LRDIMMs, DDR4-2666, and dual 10GBase-T networking. These motherboards do not specifically state which CPUs are installed.
However, Supermicro lists three other motherboards with Xeon D-2000 series processors specifically, although these aren’t specifically labeled as Xeon D platforms:
- X11SDV-16C-TP8F with Xeon D-2183IT
- X11SDV-12C-TP8F with Xeon D-2166NT
- X11SDV-8C-TP8F with Xeon D-2146NT
These three systems also support 512GB LRDIMM at DDR4-2666, but also offer support for quad GbE (I350-AM4), or dual 10G SFP+, or dual 10GBase-T. What can be derived from these product lists is that the middle part of the motherboard name, ‘16C’ or ‘12C’ are likely to be the core count numbers. This gives us the following information on potential processors:
The 'N' part is usually reserved for networking focused processors. We are in the process of speaking to Intel about the official Xeon D launch.Intel Xeon D 2018 Cores/
ThreadsBase
FrequencyL3 Cache TDP Price Xeon D-2191 18 / 36 1.60 GHz 24.75 MB 86 W $2406 Xeon D-2183IT 16 / ? ? ? ? ? Xeon D-2166NT 12 / ? ? ? ? ? Xeon D-2161I 12 / 24 2.20 GHz 16.50 MB 90 W $962 Xeon D-2146NT 8 / ? ? ? ? ? Xeon D-2141I 8 / 16 2.20 GHz 11.00 MB 65 W $555
Related Reading- Intel to Update Xeon D in Early 2018, with Skylake-SP Cores
- Intel Announces Xeon D-1500 Network Series SoCs with QuickAssist Ports
- The Intel Xeon D Review: Performance Per Watt Server SoC Champion?
More...
-
02-01-18, 09:01 PM #7820
Anandtech: Apple Announces Q1 FY 2018 Earnings
This afternoon Apple announced their earnings, and for the quarter, they had record revenues of $88.293 billion, which is up 13% from the same quarter a year ago. Margins were down 0.1% to 38.4%. Apple had an operating income of $26.274 billion, up 16.2%, and a net income of $20.065 billion, up 12.1%, which translated to earnings per share of $3.92, up from $3.38 a year ago.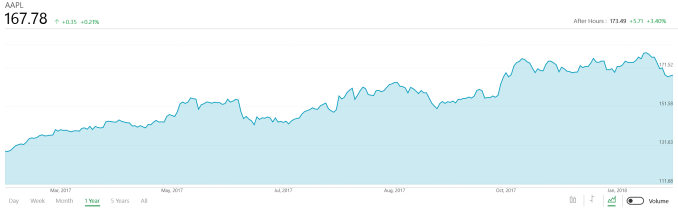
As usual, Apple’s iPhone continues to be the driving force behind Apple’s earnings. For the quarter, unit sales were down 1% from a year ago, but revenue was up 13%. Apple sold 77.3 million iPhones this quarter, with an average selling price of a staggering $796 per phone sold. It seems like Apple’s answer to a saturated market is to increase prices, and, at least for this quarter, it’s worked. Apple announced the iPhone X was the top-selling iPhone every week since it shipped in November.Apple Q1 2018 Financial Results (GAAP) Q1'2018 Q4'2017 Q1'2017 Revenue (in Billions USD) $88.293 $52.579 $78.351 Gross Margin (in Billions USD) $33.912 $19.931 $30.176 Operating Income (in Billions USD) $26.274 $13.120 $23.359 Net Income (in Billions USD) $20.065 $10.714 $17.891 Margins 38.4% 37.9% 38.5% Earnings per Share (in USD) $3.92 $2.08 $3.38
iPad sales have leveled off for now, after declining for several years. For the quarter, Apple sold 13.2 million iPads, which is up 1% from a year ago. As with iPhone, revenue was up more than sales, at 6% gain, for revenue of $5.862 billion for the quarter. That works out to an ASP of $445.10 per iPad, so despite the lower priced iPad models, Apple is still selling enough Pros to continue to grow revenue.
Mac sales fell 5% in both terms of units sold and revenue. Apple sold 5.1 million Macs this quarter, compared to 5.3 million a year ago. Revenues were $6.9 billion, so ASP for Mac is $1348.78. The latest Mac refresh hasn’t been able to continue Apple’s record of outperforming the PC market, and for this quarter it looks like the rest of the PC market actually outperformed the Mac.
Services continue to grow, and has been the second largest part of Apple’s business for some time now. Revenues for services were up 18% for the quarter to $8.471 billion. Apple announced they have an install base of 1.3 billion active users now, and their users seem to be more eager to spend money with Apple, so even though Apple’s not known as a services company, they are likely very pleased with the growth they’ve seen here.
Apple’s Other Products is the collection of devices Apple doesn’t want to announce individual unit sales for, and includes Apple TV, Apple Watch, Beats, iPod, and accessories. For the quarter, revenues grew 36% to $5.489 billion, and it’s about to overtake iPad revenues at the growth rate they’ve been seeing.
It was inevitable that the phone market would saturate at some point, and Apple seems to have run into that wall after a decade of growth. Their higher priced items appear to be the way to continue revenue growth for the time being, and the record revenues this quarter are a testament to that working. This is always the big quarter for Apple though, so we’ll have to watch and see how they do the rest of their fiscal year.Apple Q1 2018 Device Sales (thousands) Q1'2018 Q4'2017 Q1'2017 Seq Change Year/Year Change iPhone 77,316 46,677 78,290 +66% -1% iPad 13,170 10,326 13,081 +28% +1% Mac 5,112 5,386 5,374 -5% -5%
Source: Apple Investor Relations
More...


 Quote
QuoteThread Information
Users Browsing this Thread
There are currently 4 users browsing this thread. (0 members and 4 guests)


Bookmarks