

Results 4,111 to 4,120 of 12096
Thread: Anandtech News
-
07-22-14, 03:00 PM #4111
Anandtech: New Humble Bundle Offers Games From Square Enix
Today the latest Humble Bundle has gone on sale and it offers a good selection of games from the Square Enix library including all the entries in the Deus Ex franchise, titles in the Hitman series, and a variety of other titles that they have published over the years. At the usual "pay what you want" tier ($1 pledged or more is required for Steam keys) there's the following selection of games.
- Thief Gold (92% PC, 10/1999): An expanded version of Thief: The Dark Project which is a stealth game where the player takes control of a master thief who must complete objectives without being detected.
- Daikatana (N/A PC, 04/2000): A first person shooter game which takes place across different time periods and locations.
- Mini Ninjas (74% PC, 09/2009): A third person action adventure game where players control one of six playable characters, each with different items and abilities.
- Anachronox (77% PC, 06/2001): A third person role playing game where the player assumes the role of a private investigator who stumbles upon a mystery that threatens the fate of the universe.
- Hitman: Codename 47 (73% PC, 11/2000): A stealth game where players take the role of a trained hitman tasked with assassinating criminal masterminds involved in experiments that had been performed on the character.
- Hitman 2: Silent Assassin (87% PC, 09/2002): A sequel to Hitman: Codename 47 where the player again takes the role of Agent 47 and must complete missions involving the assassination of various targets.
By beating the average price which at the time of writing is at $6.63 and trending upward, a selection of more recent titles is unlocked. It's worth noting that this pricing bracket includes two games in the Deus Ex series, albeit the lesser praised of the four Deus Ex titles. More titles are expected to be added to the list below in the coming days.
- Deus Ex: Invisible War (80% PC, 12/2003): A first person shooter which is a direct sequel to the original Deus Ex which combines elements of RPG and FPS games and puts the player in a technologically advanced world filled with conspiracy .
- Deus Ex: The Fall (46% PC, 69% iOS, 07/2013): A title which originally launched on iOS and was later brought to Android and PC. It continues the story of the Deus Ex: Icarus Effect novel and features similar gameplay elements to Deus Ex: Human Revolution
- Hitman Absolution (79% PC, 11/2012): The most recent entry in the Hitman franchise. Features similar gameplay to the previous games while continuing the main character's story.
- Nosgoth Veteran Pack (N/A PC, 2014): A booster pack for an upcoming free-to-play action game that is currently in Early Acess status on steam.
- Battlestations: Midway (76% PC, 01/2007): An action game that lets the player control various air, sea, and underwater vehicles as part of naval battles during World War II.
Finally, paying more than $14.99 unlocks the whole selection of titles including some very recent ones like Deus Ex: Human Revolution Director's Cut and Just Cause 2. The original Deus Ex: Game of the Year edition is also included which rounds off the Deus Ex games for anyone who wishes to pick up the entire series in this bundle. The full list of games in the $14.99 tier is laid out below.
- Deus Ex: Human Revolution Director's Cut (91% PC, 08/2011): A prequel to the original Deus Ex. Combines elements of FPS and RPG games allowing the player to modify themselves with various mechanical augmentations and to perform various side quests in addition to the main story. The director's cut includes the Deus Ex: Missing Link DLC which was originally released after the original game.
- Just Cause 2 (84% PC, 03/2010): An open world action-adventure game that lets the player complete objectives in various different ways with an array of weapons and vehicles along with the ability to reach great vertical heights using grappling hooks and parachutes.
- Lara Croft and the Guardian of Light (82% PC, 08/2010): A platform adventure game where the character must use various weapons and skills to solve puzzles and traverse levels.
- Deus Ex: Game of the Year Edition (90% PC, 06/2000): A game which combines various elements of action, stealth, FPS, and RPG games. The player progresses through the game while upgrading their character's nano augmentations and uncovering various conspiracies involving groups like the Illuminati and Majestic 12.
- Kane & Lynch 2: Dog Days (66% PC, 08/2010): A third person shooter game where the player takes control of two criminals trying to keep alive after an arms deal goes wrong.
While it's not the most incredible Humble Bundle that has ever been put out, the Square Enix bundle offers a solid collection of games. Personally I believe that just picking up the entire Deus Ex series is well worth the $14.99 and everything on top like Just Cause 2 and Hitman: Absolution is just an added bonus. The Humble Square Enix Bundle will run for the next two weeks and payments can be split between Square Enix, the GamesAid and Make-A-Wish charities, and Humble Bundle, Inc. to help them continue to run these game bundles.
More...
-
07-22-14, 06:30 PM #4112
Anandtech: Microsoft Q4 FY 2014 Financial Results
This afternoon Microsoft held an earnings call to announce the results of their fourth quarter for fiscal year 2014.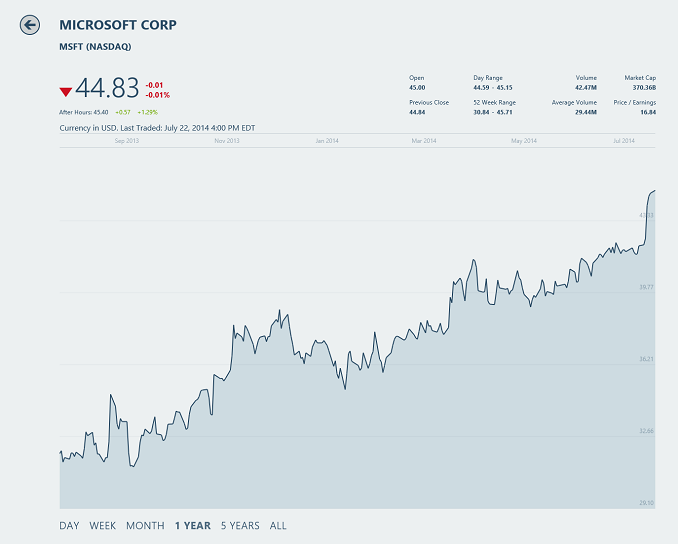
Strong growth in Microsoft’s cloud offerings offset a loss by the recently acquired Nokia Devices and Services to contribute to an overall GAAP revenue of $23.4B, up 18% from Q4 2013, and up 15% from Q3 2014. Gross Margin came in at $15.8B which is 67.5%, with an operating income of $6.5B and net income of $4.6B for the quarter. Operating income was up over Q4 2014, but net income was down due to an additional $785M set aside for income taxes. Diluted earnings per share was $0.55, which missed analysts’ expectations of $0.60. For the quarter, $3.4B was returned to shareholders which was a 17% increase from last year.
The Devices and Consumer lines came in with good results for the quarter, with the caveat that Q4 2013 included the $900M write down of Surface RT inventory which skews the results somewhat.Microsoft Q4 2014 Financial Results (GAAP) Q4'2014 Q3'2014 Q4'2013 Revenue (in Billions USD) $23.382 $20.403 $19.896 Operating Income (in Billions USD) $6.482 $6.974 $6.073 Gross Margin (in Billions USD) $15.787 $14.462 $14.294 Net Income (in Billions USD) $4.612 $5.660 $4.965 Margins 67.5% 70.8% 71.8% Earnings per Share (in USD) $0.55 $0.68 $0.59
Devices and Consumer Licensing contributed $4.7B to the overall revenues and $4.4B to Gross Margin with both values being higher both sequentially and year-over-year. Windows OEM revenue was up 3% with a split of an 11% increase in Pro revenue combined with non-Pro revenue being down 9%. The non-Pro decrease can likely be at least somewhat attributed to offering Windows free for certain devices now. Office Consumer revenue was up 21% compared to Q4 2013, and Windows Phone revenue was up 95% due to no longer having to pay for the commercial agreement with Nokia.
As for consumer hardware, revenue was up 23% from Q4 2013 at $1.44B but down from the $1.97B last quarter, and Gross Margins increased 103% year-over-year to $0.02B which is also down from $0.26B last quarter. The large increase in Gross Margin is attributed to the Surface RT right off last fiscal year and Microsoft also took a hit for not shipping a new form factor this quarter which is likely the rumored Surface Mini, which didn’t ship as expected with the Surface Pro 3. Overall Surface revenue was $409 million for the quarter. Xbox sold 1.1 million consoles this quarter, and had a 14% increase in revenue driven by increased console revenue. The new segment to Devices and Consumer hardware is the Phone Hardware, which contributed $1.99 billion in revenue but the new Nokia division came in at a $692M loss. Microsoft reported sales of 5.8 million Lumia Smartphones, and 30.3 million other phones.
The final piece of the consumer division is D&C Other, which includes Office 365 Consumer, Resale, Windows Store, Xbox Live, Bing, and a few other offerings. Revenue for this segment was up $20% year-over-year at $1.88B, but down from the $1.95B in Q3. Gross Margins were also up 21% from last fiscal at $0.45B. Microsoft added an additional 1 million new subscribers to Office 365 Home and Personal, which now totals 5.6 million subscribers. Bing advertising revenue was up 40% due to higher revenue per search, higher search volume, and an expiration of payments to Yahoo from last year. Bing search share is now at 19.2% in the US, up 130 basis points from the same time a year ago.
The commercial side is where Microsoft makes the majority of its revenue, and this quarter is no different with overall revenue coming in at $13.48B for the quarter which is an increase of 11% year-over-year. Gross Margin was also up 10% at $10.99B for the quarter. Commercial is broken down into Commercial Licensing and Commercial Other, with the former being up 6% to $11.22B in revenue and the latter up 44% to $2.26B. Commercial Licensing includes revenue for on premise offerings such as Server 2012, SQL Server, and System Center, while the Other segment is for cloud offerings and services which grey 147% from the same period last year.
So what can we learn from this quarter? Clearly Microsoft is well positioned going forward to continue its play in the enterprise, with cloud services in particular being a strong point. No other cloud provider has the product offerings which can compete for the hybrid cloud model of on premise servers running alongside cloud offerings, and they are leveraging this strength to make substantial gains in this sector. As for the consumer offerings, we now see why such drastic action was taken last week with the downsizing of the Nokia division in particular, which lost almost $700 million this quarter. A lot of the job cuts were aimed at manufacturing, and those will likely be aimed towards locations that created the non-Lumia smartphones. Earnings for the quarter were right in line or slightly over the projected results provided last quarter, assuming the Nokia earnings and loss are excluded because they were not a part of Microsoft when the projections were made. Microsoft as a company has traditionally been used to the high margin software business, and the recent push to be a hardware manufacturer has shown that this is a low margin, high risk playground with all of the major losses being in hardware. With a new CEO at the helm for the full FY 2015, we’ll have to see what his vision and patience are for the hardware segment.Microsoft Q4 2014 Segment Overview (in Billions USD) Q4'2014 Q3'2014 Q4'2013 Percentage for quarter D&C Licensing Revenue $4.69 $4.38 $4.29 20.1% D&C Licensing Gross Margin $4.41 $3.91 $3.88 27.9% D&C Hardware Revenue $1.44 $1.97 $1.17 6.2% D&C Hardware Gross Margin $0.02 $0.26 -$0.65 0.1% D&C Other Revenue $1.88 $1.95 $1.56 8.0% D&C Other Gross Margin $0.45 $0.54 $0.37 2.9% Phone Hardware Revenue $1.99 NA NA 8.5% Phone Hardware Gross Margin $0.054 NA NA 0.3% Commercial Licensing Revenue $11.22 $10.32 $10.58 48.0% Commercial Other Revenue $2.26 $1.90 $1.57 9.7% Commercial Gross Margin $10.99 $9.91 $10.00 69.6%
More...
-
07-22-14, 08:30 PM #4113
Anandtech: Apple Q3 2014 Fiscal Results Analysis
Today Apple announced its Q3 results for the period ending June 2014, and sales of the iPhone once again dominate revenue and earnings for the company.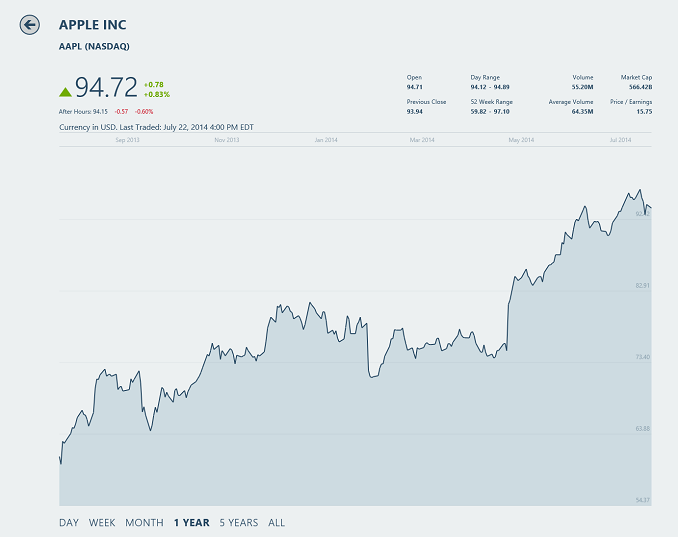
Revenue for the quarter came in at $37.4B – a 6% increase year-over-year, and a down sequentially from the previous quarter.
Net profit was $7.7B for the quarter which is up 11.6% from the same period last year, and earnings per share came in at $1.28, also up over last year’s $1.07. Gross margin was up as well at 39.4% compared to 36.9% in Q3 2013.
Once again, the iPhone is the dominate force for Apple right now, accounting for $19.75B in revenue for this quarter with 35.203 million iPhones sold. The device numbers and revenue are both down over last quarter, but sales are up 13% year-over-year with revenue close behind at a 9% gain. Apple doesn’t break down numbers for each model, but using some math we can see the revenue per unit sold at $561 which is a great number.Apple Q3 2014 Financial Results (GAAP) Q3'2014 Q2'2014 Q3'2013 Revenue (in Billions USD) $37.432 $45.646 $35.323 Operating Income (in Billions USD) $10.282 $13.593 $9.201 Gross Margin (in Billions USD) $14.735 $17.947 $13.024 Net Income (in Billions USD) $7.748 $10.223 $6.900 Margins 39.4% 39.3% 36.9% Earnings per Share (in USD) $1.28 $1.66 $1.07
Software, Services, and App/Music store sales came in at $4.485B for the quarter which is down 2% compared to last quarter but up 12% year-over-year.
Mac sales were up again with 4.4 million Macs sold which accounted for $5.5B in revenue. Sales were up 18% and revenue was up 13% compared to Q3 2013, with an increase in sales of 7% over last quarter with revenue remaining flat.
iPad sales have definitely slowed, with the second quarter in a row of decline. Total sales were 13.2 million units for a revenue of $5.9B, but the device sales are down both year-over-year (9%) and sequentially (19%).
Unsurprisingly, iPod sales continued their decline with 2.9 million devices sold – down 36% year-over-year. Revenue for the iPod was $442,000 which was down 40% from Q3 2013. Somewhat surprising was that iPod sales ticked up 6% from last quarter, but revenues declined 4%.
Finally, accessories now account for about three times the revenue of the once ubiquitous iPod, with revenue for the quarter of $1.3 million which is up 12% over last year’s numbers.
During this quarter, Apple performed a 7-1 stock split, and returned $8 billion to shareholders through dividends and the share repurchase program. Apple will pay a dividend of $0.47 per share on August 14 for this quarter’s results.Apple Q2 2014 Revenue by Product (billions) Q3'2014 Q2'2014 Q3'2013 Revenue for current quarter iPhone $19.751 $26.064 $18.154 52.8% iPad $5.889 $7.610 $6.374 15.7% Mac $5.540 $5.519 $4.893 14.8% iPod $0.442 $0.461 $0.733 1.2% iTunes/Software/Services $4.485 $4.573 $3.990 12% Accessories $1.325 $1.419 $1.179 3.5%
Analysts were hoping for 36 to 38 million iPhones to be sold this quarter, with sales missing that mark. iPad sales were also lower than expected. With the new iPhone likely not being released until Q1 of fiscal year 2015, outlook for the next quarter is also lower.
While sales were still strong for the iPhone, the iPad has now declined in numbers for the second straight quarter. Mac sales were up a healthy 18% year-over-year which means the Mac is almost back to being the number two revenue stream for Apple. We seem to have hit some maturity in the tablet market, and upgrade cycles aren’t quite as quick as they are in the smartphone space. The waiting game is now on for new product announcements from Apple to keep the sales strong.Apple Q3 2014 Device Sales (millions) Q3'2014 Q2'2014 Q3'2013 iPhone 35,203 43,719 31,241 iPad 13,276 16,350 14,617 Mac 4,413 4,136 3,754 iPod 2,926 2,761 4,569
More...
-
07-22-14, 08:30 PM #4114
Anandtech: Google Play App Updated to 4.9.13 With Material Design App Pages
Google has begun the rollout of an update to the Google Play application on Android. At first glance the update doesn't seem to have any big changes. The sliding menu is the same, and the Play Store home page is the same as it has been for a while. Once you actually navigate to the page for an app it's very clear that this is a bigger update than a quick glance lets on. Google has redesigned the app pages with new animations and a new design to fit in with their new Material Design style.
As you can see, the new design is much different and this applies to almost every aspect of the design from the colors to the shapes to the animations. The first thing that stands out is the change in background color from grey to white. While this is a matter of personal preference, I find the white much more appealing than the grey. Google has also shifted around many parts of the application. The positions of app screenshots and the app changelog have been moved to put better focus on the actual information on the page. Apps that have a video trailer will have it prominently displayed at the top. The changes to animations are difficult to describe in photos but what can be said is that they take advantage of the idea of layers and objects in Material Design. As you scroll downward the page gradually begins to cover up the space where the trailer was as it is pushed offscreen. When selecting "read more" in the app changelog the top and bottom sections of the app are pushed offscreen and the user is greeted with a fullscreen view containing only the relevant information about the app description, changes, and developer info.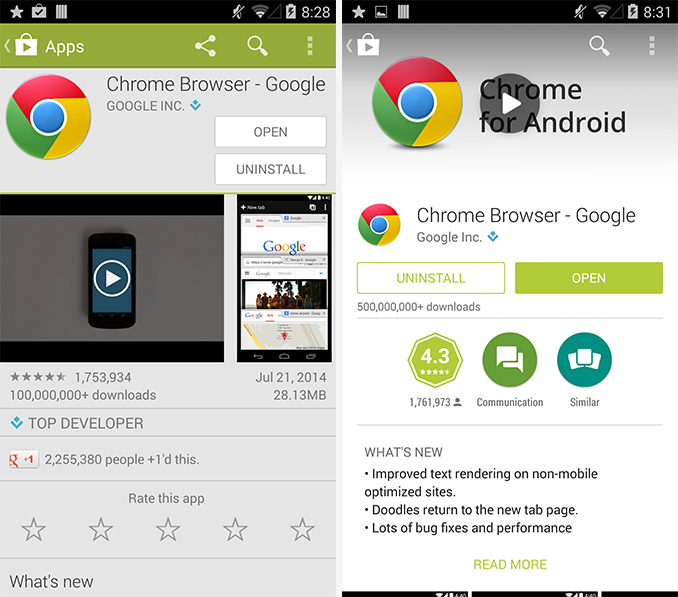 Old Google Play on the left, new on the right.
Upon scrolling down you can see that Google has increased the size of the application photos. With the video trailer moved to the top of the application there's also much more space to display screenshots which is good for developers hoping to show off their application. Google has also added more color to the application by color coding the bars that represent the ratings given by users. The overall app itself also has fewer horizontal lines separating sections which leads to a much cleaner look, particularly in the reviews section of the app page. Finally, Google has moved the share and Google+ buttons down beneath the reviews section from its previous position right underneath the app screenshots.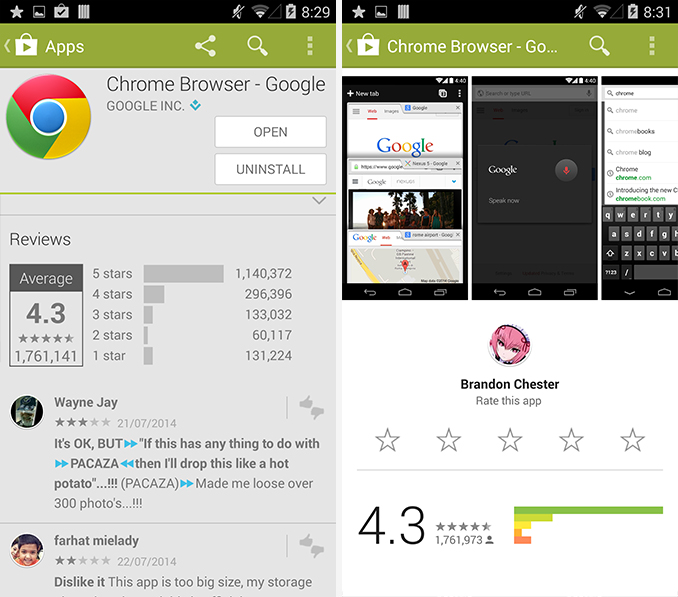
This update isn't quite the complete Material Design overhaul that users are excited for. That will likely come closer to the time that we see Android L released in the fall. But for now it gives good insight into where Google is headed with app design and what can be looked forward to for all of Google's apps going into the future. As with all of Google's app updates, it may take some time for the new application to reach your device.
More...
-
07-23-14, 02:07 AM #4115
Anandtech: Z97 Mini-ITX Review at $140: ASRock, MSI and GIGABYTE
With every new chipset release, a large part of the community is always interested in the smaller form factor builds. Building a small yet powerful system seems to be an expanding niche, and for Intel’s Z97 platform we took three of the cheaper mini-ITX motherboards to see how they compare. The ASRock Z97E-ITX/AC, the MSI Z97I AC and the GIGABYTE Z97N-WIFI are all between $130 and $140, all feature 802.11ac support but vary in other connectivity, ease of use and their packages. We compared all three.
More...
-
07-23-14, 09:33 AM #4116
Anandtech: Nokia Announces New Low Cost Lumia 530
Nokia has had a lot of success with Windows Phone in the more budget-oriented segment of the market. The Lumia 630, which we recently reviewed, does well in its position in the $150-200 device bracket. But Nokia is hoping to target buyers at even lower price points with the new Lumia 530 which positions itself to take on other Android devices at the $100-150 segment of the market. At least in its name it is a successor to Nokia's Lumia 520 which was the most popular Windows Phone, and the two are compared down below.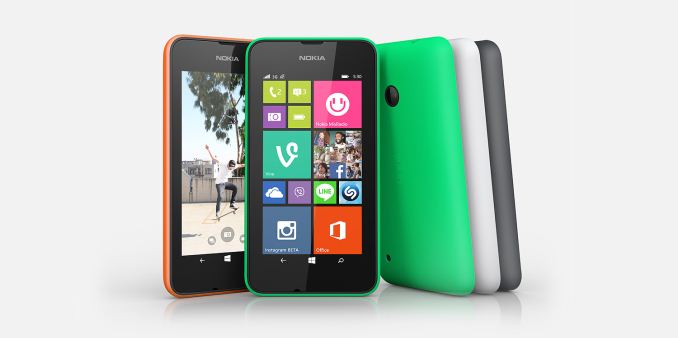
As you can see, the Lumia 530 has many similarities to its predecessor. Inside it makes the move from Qualcomm's Snapdragon S4 platform to the newer Snapdragon 200 platform. It'll be interesting to see how the quad core 1.2GHz Cortex A7 implementation fares against the 1GHz dual core Krait implementation. The GPU takes a performance hit, going from the Adreno 305 to the 302. Storage similarly takes a small step down with half the internal NAND of the Lumia 520, but with support for MicroSDXC up to 128GB rather than 64GB in the 520. RAM and connectivity remains the same with 512MB of LPDDR2 memory, single stream 802.11n WiFi, Bluetooth 4.0, and 21.1Mbps HSPA+. The battery chemistry remains the same as well at 1430mAh and 3.7V.Lumia 520 and 530 Lumia 520 Lumia 530 SoC 1GHz Dual Core Krait (MSM8227) + Adreno 305 1.2GHz Quad Core Cortex A7 (MSM8212) + Adreno 302 Memory 512MB LPDDR2 512MB LPDDR2 Storage 8GB NAND + MicroSDHC 4GB NAND + MicroSDXC Display 4” 800x480 WVGA LCD 4” 854x480 FWVGA LCD Cellular Connectivity GPRS/EDGE/HSPA+ GPRS/EDGE/HSPA+ Dimensions 119.9 x 64 x 9.9 mm, 124g 119.7 x 62.3 x 11.7 mm, 129g Camera 5MP Rear Facing w/ F2.4 aperture 5MP Rear Facing w/ F2.4 aperture Battery 5.291Wh 5.291Wh OS Windows Phone 8.1 Windows Phone 8.1 Other Connectivity 802.11b/g/n + BT 4.0, USB2.0, GPS/GNSS 802.11b/g/n + BT 4.0, USB2.0, GPS/GNSS SIM Size Micro-SIM Micro-SIM (dual SIM variant)
The front of the device sports an 854x480 LCD display, with the extra 54 pixels compared to the Lumia 520 being used for the on-screen buttons in a similar fashion to the Lumia 630. The move from a 15:9 display aspect ratio to a 16:9 ratio allows for a small decrease in the width of the device. The 530 has an appreciable increase in thickness compared to its predecessor with a thickness of 11.7mm at its thickest point compared to 9.9mm on the 520. No apparent changes to the camera have been made with a 5MP F2.4 sensor on the back and there's no front-facing camera.
The 530 seems like a mixed bag of upgrades and downgrades compared to the 520. At 4GB of storage it really necessitates buying a MicroSD card even for users who rarely use apps, while the 8GB in the 520 leaves more breathing room. The increase in thickness is also disappointing but in the 530's price bracket there's no pressure to battle it out for the title of thinnest smartphone. In many ways it feels less like an upgrade and more like a device of its own. It will be interesting to see how users feel it compares to the original Lumia 520.
The Lumia 530 will be launching in single and dual-sim variants in August with a target price point of €85. Ignoring differences in taxes and market situations that translates to rougly $114 in the US or £67 in the UK.
More...
-
07-23-14, 12:31 PM #4117
Anandtech: Best SSDs: July 2014
Given the recent product releases in the SSD industry, it is now a good time to do another purchase recommendation post. We did our first "Best SSDs" post in November last year and it received quite a bit of interest by providing simple recommendations instead of a several thousand word analysis like we usually do in our reviews. Quite surprisingly, our previous recommendations were still accurate until about a month ago when Crucial rolled out the MX100, so despite the fact that the article is now eight months old there was no immediate need for an updated post until now.
Similar to the previous post, I will be splitting the recommendations in different categories by form factor and performance. Note that pricing fluctuates constantly and there may be regional differences, so I would still recommend to check the prices from several stores and use your own consideration when buying a drive.
Enthusiast and Professional Level: Samsung SSD 850 Pro & SanDisk Extreme ProThe Samsung 850 Pro is one unique drive. It is the first mainstream SSD to utilize 3D NAND, which gives Samsung substantial advantages in performance and endurance. As a result, the 850 Pro is the fastest SSD we have tested and is backed up by an industry-leading 10-year warranty or 150TB of writes, which ever comes first. Feature wise the 850 Pro supports both TCG Opal 2.0 / eDrive and DevSleep, meaning that the drive is suitable for mobile as well as corporate environments. The 850 Pro also has a feature called RAPID, which utilizes a portion of the system DRAM (up to 4GB) to cache reads and writes to further increase performance.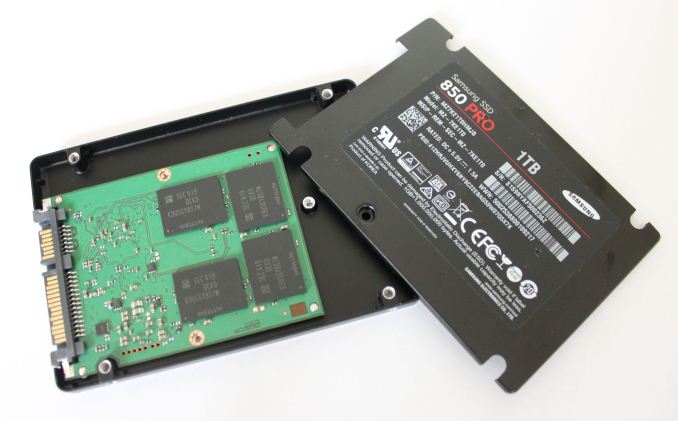
The 850 Pro's toughest competitor is SanDisk's Extreme Pro. While the 850 Pro is generally a faster drive, the Extreme Pro comes very close. It too is backed up by a 10-year warranty, although the write endurance is only rated at 80TB. Due to higher over-provisioning, the usable capacities in the Extreme Pro end up being slightly smaller compared to the 850 Pro and you also lose TCG Opal 2.0 / eDrive support.
I am usually not a big fan of pros&cons tables because they tend to oversimplify things, but in this case I think the comparison does justice and provides a quick way to compare the 850 Pro and Extreme Pro. It is clear that the 850 Pro is ultimately the better drive but the Extreme Pro can be a better option if you are in the look for a high performance 1TB-class drive but do not see any additional value in the 850 Pro's features (namely hardware encryption and RAPID).Samsung SSD 850 Pro SanDisk Extreme Pro Pros - Higher performance
- Higher usable capacities
- Higher endurance
- TCG Opal 2.0 & eDrive support
- RAPID- Price of the larger capacities Cons - Price of the larger capacities - No hardware encryption support
- Lower endurance
That said, if you want the best SATA 6Gbps drive in the market, the 850 Pro is the drive to buy. You will have to pay a small premium at the higher capacities, although the price delta may even out in the future and make the 850 Pro a better buy in all aspects. Alternatively, if the prices of the Extreme Pro come down (or you are in a region where the price difference is higher than in the US), the Extreme Pro is a viable alternative as long as you have no need for hardware encryption.Capacity 120/128GB 240/256GB 480/512GB 960/1024GB Samsung SSD 850 Pro $130 ($1.02/GB)
£90 (£0.70/GB)$200 ($0.78/GB)
£155 (£0.61/GB)$400 ($0.78/GB)
£295 (£0.58/GB)$700 ($0.68/GB)
£485 (£0.47/GB)SanDisk Extreme Pro - $210 ($0.88/GB)
£135 (£0.56/GB)$370 ($0.77/GB)
£252 (£0.53/GB)$600 ($0.63/GB)
£392 (£0.41/GB)
Mainstream Level: Crucial MX100 & Samsung SSD 840 EVOIn the mainstream segment, the MX100 dominates the market. The exceptional pricing alone makes the MX100 an alluring drive but the fact that the drive supports power-loss protection, DevSleep and hardware encryption (TCG Opal 2.0 & eDrive) makes it an excellent bang for the buck. With performance good enough for typical client workloads, there is simply no way you can go wrong with the MX100, unless your workload requires a higher performance drive.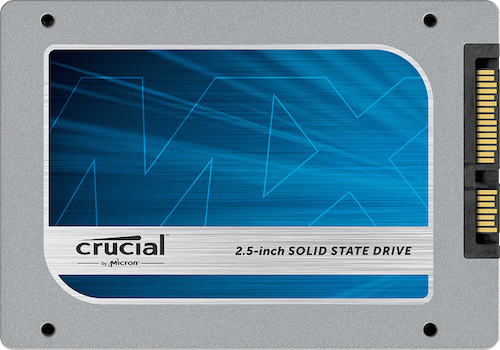
The only disadvantage of the MX100 is the lack of a 1TB model, which is why I am recommending the 840 EVO as well since it comes in 1TB flavor. In terms of features and performance the MX100 and 840 EVO are very close with the biggest difference being that the EVO has no power-loss protection, although on the other hand it supports RAPID, which the MX100 does not have. As a result, the only reason I am picking the MX100 over the 840 EVO is the price but if you can find the 840 EVO cheaper (or are looking for a 1TB drive), then do not hesitate to buy the 840 EVO instead of the MX100.Capacity 120/128GB 250/256GB 500/512GB 1TB Crucial MX100 $75 ($0.59/GB)
£54 (£0.42/GB)$110 ($0.43/GB)
£94 (£0.37/GB)$215 ($0.42/GB)
£161 (£0.31/GB)- Samsung SSD 840 EVO $90 ($0.75/GB)
£57 (£0.47/GB)$140 ($0.56/GB)
£88 (£0.35/GB)$260 ($0.52/GB)
£165 (£0.33/GB)$470 ($0.47/GB)
£300 (£0.30/GB)
Killing Off The SATA Bottleneck: Samsung XP941PCIe has certainly been one of the most discussed topics within the SSD industry this year. While the true roll out of native PCIe SSDs will not happen until next year, there are now a couple of drives available. The only drive that I find interesting is the Samsung XP941 because it is currently the only native PCIe 2.0 x4 drive, whereas the other drives in the market are limited to x2, which does not provide that much benefit over SATA 6Gbps. As a result the XP941 is the fastest client SSD we have tested to date and is hence the ultimate drive for performance hungry enthusiasts.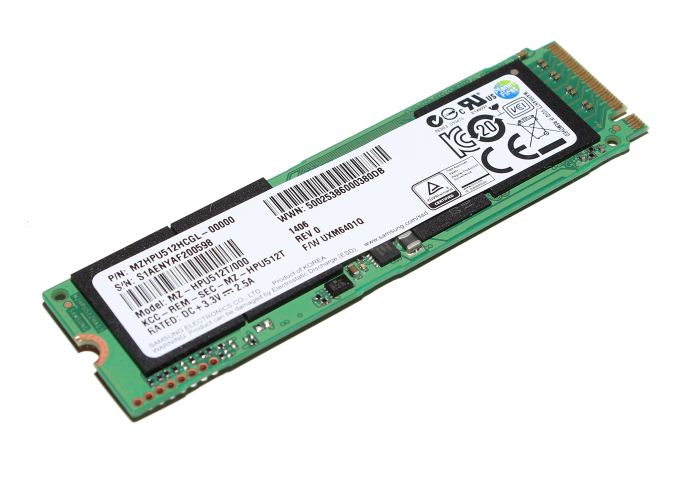
The only downside is that you will need a Z97 based motherboard (or a Mac Pro) to be able to boot from the drive and even then you are limited to certain models (at this point ASRock Z97 Extreme6 is the only board with official boot support, although the drive can be made bootable in some ASUS boards as well). Thus I would only recommend the XP941 if you are running a supported motherboard because otherwise the XP941 can only be used as a secondary drive. Compared to the 850 Pro you will also lose hardware encryption plus RAPID support and the warranty drops to three years.
The pricing is also rather high compared to the 850 Pro but that is the premium you have to pay for cutting technology. Interestingly enough, the 512GB XP941 is currently available in NewEgg even though the drive is an OEM product. Unfortunately the 256GB model is not but you can still find it from RamCity, which was the first vendor to sell the XP941 to consumers and also supplied us with review samples.Capacity 256GB 512GB Samsung XP941 $311 ($1.21/GB)
-$500 ($0.98/GB)
£400 (£0.78/GB)
All in all, if you are willing to pay the premium and sacrifice support for the opportunity to be at the edge of a new technology, the XP941 is the drive to buy.
The Tiny, Yet Powerful mSATA: Crucial M500 mSATA, Samsung SSD 840 EVO mSATA & Plextor M6MWhile the SSD and PC industries are moving away from mSATA to M.2, there is a notable upgrade market for mSATA drives. mSATA never really took off so the available SKUs are still rather limited, but fortunately there are a couple of drives that stand out. The first one is the mSATA version of the Samsung 840 EVO, which is the little brother of the 2.5" 840 EVO we already recommended above. You get the same set of features (hardware encryption, DevSleep, RAPID...) and performance as with the full size 840 EVO, so the EVO mSATA is a great value despite its small size.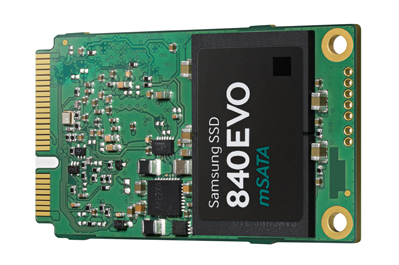
An alternative to the 840 EVO mSATA is Plextor's M6M. The M6M lacks TCG Opal 2.0 and eDrive compliance and is also a bit slower than the 840 EVO, but it is still a good option for typical client workloads as long as the lack of hardware encryption is not a deal breaker.
Update: I have added Crucial M500 mSATA to the list since it is the most affordable mSATA SSD and still offers a great set of features (hardware encryption and power-loss protection) and decent performance. Initially I left it out as I thought it had been discontinued like its 2.5" sibling but looks like it is still available and seems to be the best value.
The 840 EVO mSATA does not come in 64GB flavor at all, so if you are looking for a small and cheap boot mSATA drive, then the M6M is our only recommendation, although I strogly advice that you pay $26 more for doubled capacity. At 120/128GB the M6M is a better pick due to its cheaper price, unless you see added value in the features of the 840 EVO mSATA. However, at 250/256GB and higher the EVO is certainly a better value for the money.Capacity 64GB 120/128GB 250/256GB 500/512GB 1TB Samsung SSD 840 EVO mSATA - $100 ($0.83/GB)
£70 (£0.58/GB)$160 ($0.64/GB)
£105 (£0.42/GB)$300 ($0.60/GB)
£185 (£0.37/GB)$500 ($0.50/GB)
£330 (£0.33/GB)Plextor M6M $60 ($0.94/GB)
£50 (£0.78/GB)$86 ($0.67/GB)
£83 (£0.64/GB)$150 ($0.59/GB)
£116 (£0.46/GB)$360 ($0.70/GB)
-- Crucial M500 mSATA - $75 ($0.59/GB)
£52 (£0.43/GB)$125 ($0.52/GB)
£89 (£0.37/GB)$240 ($0.50/GB)
£168 (£0.35/GB)-
Given the price of the M500 mSATA, it is the best value for most consumers. While performance is not as good as with the 840 EVO, the M500 mSATA is fast enough for average consumer workloads and is thus the drive we recommend. Users who seek for more performance in an mSATA form factor may find the 840 EVO to be worth the extra money but otherwise the M500 mSATA is a better buy. The only exception is at 1TB where the 840 EVO mSATA is the only option.
The Gumstick M.2: Crucial M550 M.2The market for aftermarket M.2 SSDs is relatively small right now since systems with M.2 have not been shipping for long but the market is constantly growing. I could not find many available on NewEgg but if I was on the market for one I would pick Crucial's M.2 version of the M550. We have not reviewed the M.2 version but it is fairly safe to assume that the performance is similar to the 2.5" version (our review). The M550 M.2 is type 2280, so make sure that it is compatible with your motherboard or laptop since some only accept smaller M.2 sizes. Like the MX100, the M550 M.2 features an extensive feature set including power-loss protection and TCG Opal 2.0 / eDrive support along with DevSleep support.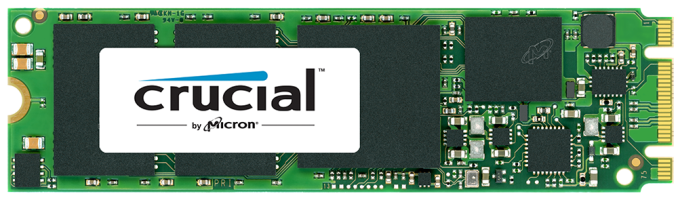
Note: The M550 M.2 is a SATA 6Gbps drive, so before buying the drive make sure that the slot in your motherboard or laptop supports SATA. Some only support PCIe, meaning that the M550 will not work in such slot.
To Conclude:Capacity 128GB 256GB 512GB Crucial M550 M.2 $100 ($0.78/GB)
£68 (£0.53/GB)$170 ($0.66/GB)
-$330 ($0.64/GB)
£228 (£0.45/GB)
The last couple of months have been very interesting in the SSD industry. We have seen quite a few new SSDs and it seems like the flow will not end. From what I have heard, we should see several TLC NAND based SSDs this year, which will help to drive the cost per gigabyte down. Additionally, more PCIe SSDs should start to roll out early next year, so the XP941 should finally see some real competition.
More...
-
07-23-14, 04:30 PM #4118
Anandtech: First Look: The $799 Microsoft Surface Pro 3 with Core i3
Earlier this Summer Microsoft released Surface Pro 3, a fully equipped Haswell ULT based tablet in a chassis that was much more in line with what you'd expect from a tablet. From a hardware standpoint, Surface Pro 3 is the chassis design that Microsoft needed from the very start. If you've ever been tempted by the Surface Pro story, the latest model was bound to push you over the edge.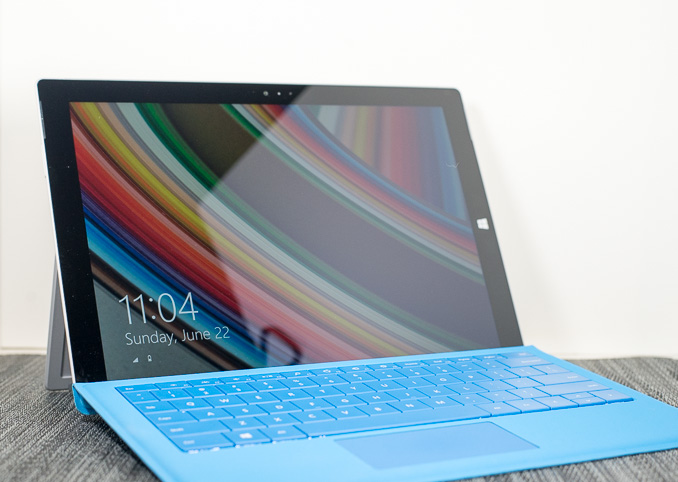
Unlike previous generations however, Microsoft delivered multiple CPU/GPU options with Surface Pro 3. The device's price range extends both lower and higher than any prior iteration. While the original Surface Pro launched at $899 and $999, the second version offered increased storage options that drove the max price up to $1799. Surface Pro 3 starts at just $799 and can be configured at up to $1949. In our review we were sampled one of the launch versions of the tablet, a $1299 configuration featuring Intel's Core i5-4300U. Until next month the Core i5 models are the only ones available, however starting on August 1st you'll be able to purchase cheaper Surface Pro 3s with a Core i3-4020Y or more expensive versions with a Core i7-4650U.
We just got our hands on the $799 entry level Core i3 configuration and are in the midst of a full review of the device. Battery life testing alone will take a few days, but I wanted to share some of my initial performance data since there is a pretty substantial difference between the Core i3 and i5 models. For a quick refresher, this is what the Surface Pro 3 lineup looks like:
To hit the $799 price point Microsoft went to a 64GB M.2 SATA SSD. Interestingly enough, the CPU doesn't actually save Microsoft any money. The Core i3-4020Y carries the same 1000Ku price as the i5-4300U ($281). The Y at the end of the part number implies a Haswell ULx SKU, the only Haswell type to ship with a SDP as well as a TDP rating. Even using the same workload, the Y-series parts weigh in with a lower TDP than the more typically used U-series parts (11.5W vs. 15W). Given the substantial reduction in chassis thickness, I suspect the Y-series parts may have been a better fit for the design to begin with.Microsoft Surface Pro 3 Configuration Options Configuration $799 $999 $1299 $1549 $1949 CPU Intel Core i3-4020Y Intel Core i5-4300U Intel Core i5-4300U Intel Core i7-4650U Intel Core i7-4650U SDP/TDP 6W/11.5W -/15W -/15W -/15W -/15W Cores/Threads 2/4 2/4 2/4 2/4 2/4 Frequency Base/Max Turbo 1.5GHz/- 1.9/2.9GHz 1.9/2.9GHz 1.7/3.3GHz 1.7/3.3GHz GPU Intel HD 4200 Intel HD 4400 Intel HD 4400 Intel HD 5000 Intel HD 5000 GPU EUs 20 20 20 40 40 GPU Frequency Base/Max Turbo 200/850MHz 200/1100MHz 200/1100MHz 200/1100MHz 200/1100MHz Storage 64GB SSD 128GB SSD 256GB SSD 256GB SSD 512GB SSD RAM 4GB 4GB 8GB 8GB 8GB
You do give up performance in the process however. Since this is a Core i3 processor Intel disables turbo boost in addition to lowering the base frequency of the chip in order to hit its 11.5W TDP. At 1.5GHz without turbo, peak single threaded performance could be as little as half of the Core i5 models. The GPU performance story is arguably more interesting. Although there's a decrease in max GPU turbo, I wonder if the lower TDP may help improve sustained performance in games. I ran a few tests to see how things change with the move to a Core i3. Let's start with a look at the CPU.
Single/Multithreaded Performance - Cinebench 11.5
One of the benefits of a Surface Pro is the ability to run heavy PC workloads just as well as lighter tablet workloads. The device can behave as a tablet, notebook or even a desktop. We'll start with Cinebench 11.5, an offline 3D renderer that is largely CPU bound. The single threaded incarnation of this benchmark should give us a good look at the worst case scenario performance delta between the Core i3 and Core i5 Surface Pro 3s:
Without the ability to boost above its 1.5GHz base clock, the Core i3-4020Y comes in substantially slower than the Core i5-4300U model. It turns out a 1.5GHz Haswell core is around the performance of a 2.3GHz AMD Piledriver core.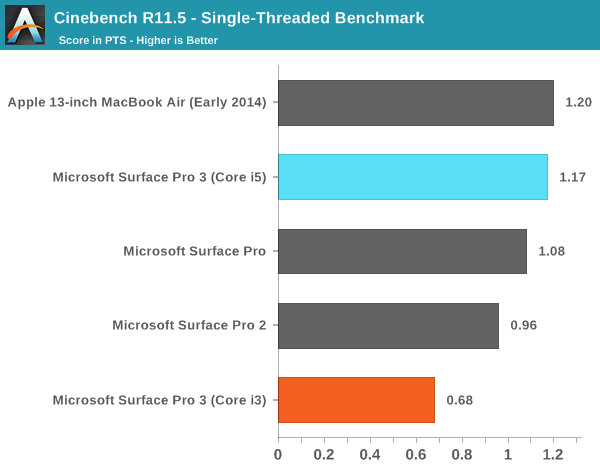
With both cores (and all four threads) active, the gap between the Core i3 and Core i5 parts doesn't really shrink any. It's clear that if you're after running heavier PC workloads on your Surface Pro 3, you'll want to spring for the Core i5.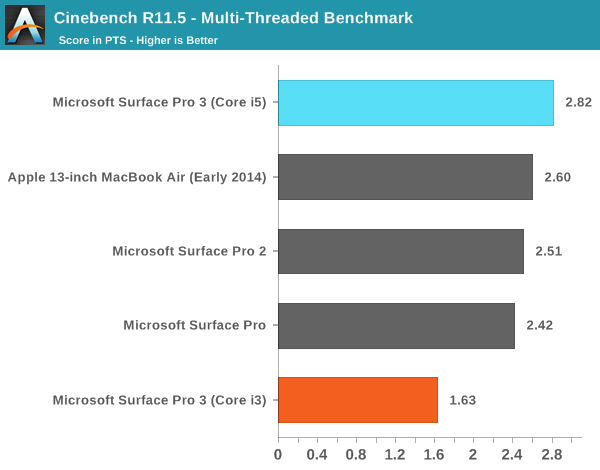
General Usage Performance - PCMark 8 v2
Cinebench may overstate the difference you'll see between the $799 and $999/$1299 models in regular usage, so we turn to PCMark 8 v2 and PCMark 7 to give us a better look at real world performance differences when running lighter tasks. PCMark 8 v2 runs through a bunch of usage driven application scenarios grouped into home, creative and work usage flows.
From Futuremark's description of the Home test:
"The PCMark 8 Home benchmark includes workloads that reflect common tasks for a typical home user. These workloads have low computational requirements making PCMark 8 Home suitable for testing the performance of low-cost tablets, notebooks and desktops. Home includes workloads for web browsing, writing, gaming, photo editing, and video chat. The results are combined to give a PCMark 8 Home score for your system."A 20% increase in performance is what the Home suite shows for the i3->i5 upgrade, and that seems fairly reasonable. The Core i3 model ends up performing quite similarly to the original Surface Pro, but in a much more appealing chassis.
Next up is the Creative test:
"The PCMark 8 Creative benchmark includes workloads typical of enthusiasts and professionals who work with media and entertainment content. With more demanding requirements than the Home benchmark, this benchmark is suitable for mid-range computer systems. PCMark 8 Creative includes web browsing, photo editing, video editing, group video chat, media transcoding, and gaming workloads."The creative suite shows a larger 34% advantage for the Core i5 vs. Core i3. Once again the i3 performs within 10% of the original Surface Pro, but for heavier use cases the Core i5 is necessary if you want Ultrabook/Macbook Air-class performance in a Surface Pro 3.
Finally we have the Work test:
"The PCMark 8 Work benchmark test measures your system's ability to perform basic office work tasks, such as writing documents, browsing websites, creating spreadsheets and using video chat. The Work benchmark is suitable for measuring the performance of typical office PC systems that lack media capabilities. The results from each workload are combined to give an overall PCMark 8 Work score for your system."Here we see another 33% advantage for the Core i5, and surprisingly enough a pretty similar gap between the Core i3 SP3 and the original Surface Pro. It's really the lighter workloads that will understandably show less of a gap between the i3 and i5.
PCMark 7
I'm also including PCMark 7 results which tend to fall in between the PCMark 8 v2 results, here showing a 26% advantage for the Core i5 model.
GPU Performance - 3DMarks
I'll split our look at PC GPU performance into two sections, first let's look at peak theoretical performance using 3DMark. The Core i5-4300U has a 29% higher peak GPU clock compared to the Core i3-4020Y so we could see gains of up to that in any GPU bound scenario.
The heaviest 3DMark 2013 test here is Fire Strike and we see a 27% advantage for the Core i5 vs. Core i3 model. Note that the i3 is still substantially quicker than the original Surface Pro.
In lighter graphics workloads the gap narrows, with the Core i5 model holding a 21% performance advantage over the Core i3. The entry level Surface Pro 3 still delivers substantially better GPU performance than the original Surface Pro.
The Ice Storm test seems to provide a good mix of CPU and GPU bound work for the platforms, which contributes to the largest gap we've seen thus far in our GPU tests of 30%.
Looking at 3DMark 11 there's virtually no performance difference between the two platforms. This ends up being a bit more strenuous of a test, likely forcing the Surface Pro 3 into a thermally constrained situation where GPU clocks can't remain at max for long.
PC Gaming Performance - Dota 2
In our original Surface Pro 3 review I asked Ryan Smith to put together a reasonable Dota 2 benchmark to better illustrate what a prolonged light graphics workload would do to the system. In the end I found that the thermal constraints and default fan profile of Surface Pro 3 can contribute to lower sustained performance vs. Surface Pro 2. Our Dota 2 benchmark did a great job of showcasing a real world scenario where SP3 could be appreciably slower than SP2.
With the Core i3 version I was curious as to whether the better binning and overall power reduction would result in a device that would be able to sustain a higher level of performance for longer than the Core i5 version. I ran the Core i3 model through the exact same Dota 2 workload and came away with some interesting results:
Whereas the Core i5 model couldn't make it through a single run of our test without stepping down in performance, the first run on the Core i3 system came very close to the performance of the Surface Pro 2. Subsequent runs however did drop to performance similar to the Core i5 model, although the i3 is able to sustain higher performance.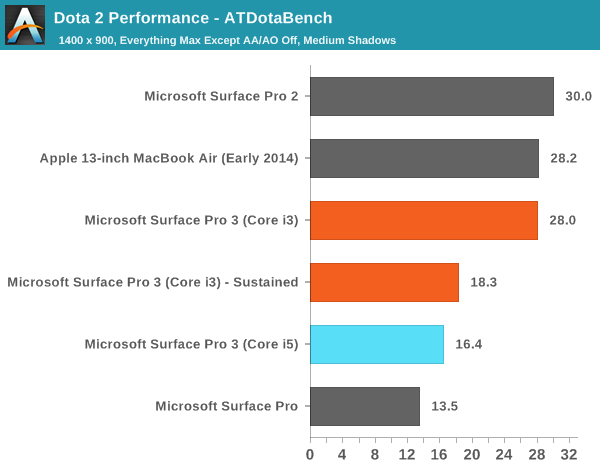
SSD Performance
My original review sample featured a 256GB Samsung PM851 (an OEM version of the SSD 840 EVO) SSD. The $799 Core i3 model I received features a 64GB SSD, and in my case it's an SK Hynix drive. SK Hynix is a fully vertically integrated NAND and controller manufacturer thanks to its acquisition of Link A Media. The HFS064G3AMNB-2200A in my Core i3 based Surface Pro 3 uses a LAMD 87800 controller like the Corsair Neutron/Neutron GTX and Seagate SSD 600 series of SSDs. Both of those drives proved to be highly consistent performers, even when running in a full state. I'm not sure if all 64GB models will use the Hynix/LAMD drive, but given how little free space is available on the 64GB drive I would hope as many of them are this configuration as possible. After installing my relatively limited suite of tests for this review I had 10GB free on the device, with Windows telling me that another 10.5GB was taken up by things I'd installed.
PCMark 8 v2's storage test gives us a good look at high level performance, and here there's no real difference between the 64GB and 256GB drives:
However this is a bit of an optimistic look, I turned to Crystal Disk Mark to give us a quick idea of peak sequential and random performance:
Testing over a 4GB span there's clearly a reduction in sequential and random IO performance but both are quite solid on the 64GB model. I don't expect users to store large files on a 64GB Surface Pro 3 so the reduction in sequential read/write speed isn't a huge deal. Overall I'm quite pleased with the performance of the 64GB drive in my i3 sample.
 64GB Hynix SSD (left) vs. 256GB Samsung SSD (right)
Tablet Performance
Last but not least, I wanted to look at how the Core i3 would perform in a lighter set of benchmarks we typically run our ARM based tablets through. Surface Pro has always ended up at the top of these tests, but we've never had a Surface Pro clocked as low as the Core i3 SP3. At 1.5GHz this also gives us an interesting look into the IPC comparison between Haswell and Apple's Cyclone cores as the iPad Air runs at a similar frequency (1.4GHz). Do keep in mind that there's a fairly large difference in platform power between a Surface Pro 3 and an iPad Air however.
The light workload js benchmarks end up being great measures of single threaded performance, which is why we see such a substantial difference between the Core i5 and i3 models here. That being said, the i3 based Surface Pro 3 still ends up being faster than any of the traditional ARM tablets. The iPad Air comes dangerously close though.
Kraken tells a similar story, although here we see a larger gap between the i3 based Surface Pro 3 and the iPad Air.
The GPU performance story is no different than in our earlier tests. The i3 model takes a hit, but GPU performance is understandably much better than any other tablet you'd come across.


Final Words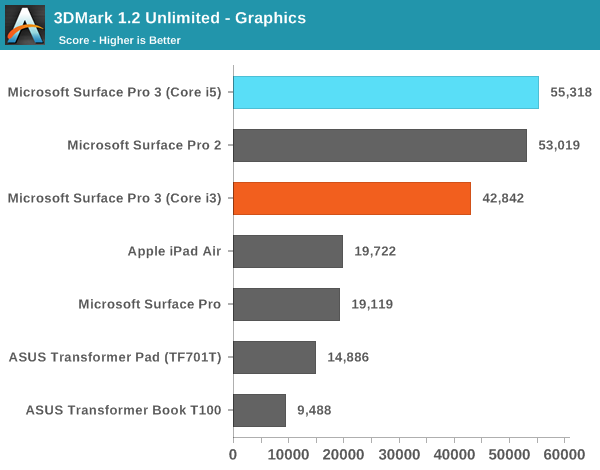

Subjectively, the entry level Surface Pro 3 feels pretty quick. Even running at only 1.5GHz, a pair of Haswell cores are plenty fast. The real question is whether or not the extra $200 is worth the increase in performance. For anyone looking to use the Surface Pro 3 like a real PC and less like a tablet, the $200 Core i5 upgrade is a wise investment. Lighter tasks and more tablet oriented usage models however may not merit the extra expense. In a lot of lighter tasks we're looking at a 20 - 30% advantage to the Core i5 for a 25% increase in system cost. Ultimately I feel like the increase in storage capacity in addition to CPU performance may be what really justifies the larger expenditure for users who don't necessarily need the extra CPU performance.
The big unanswered question at this point is whether there are any gains in battery life. I'm working on producing that data now and I'll post a follow up once it's complete.
More...
-
07-24-14, 05:43 AM #4119
Anandtech: ASUS ROG Swift PG278Q Monitor Released in APAC/EU, North America Coming Se
One of ASUS’ many releases during Computex was for their new ROG Swift PG278Q monitor that boasted a number of impressive specifications all at once. The PG278Q combines a 2560x1440 panel capable of 120/144 Hz operation with support for NVIDIA G-Sync and 3D Vision, putting it firmly in the region of gaming and hence the ROG moniker.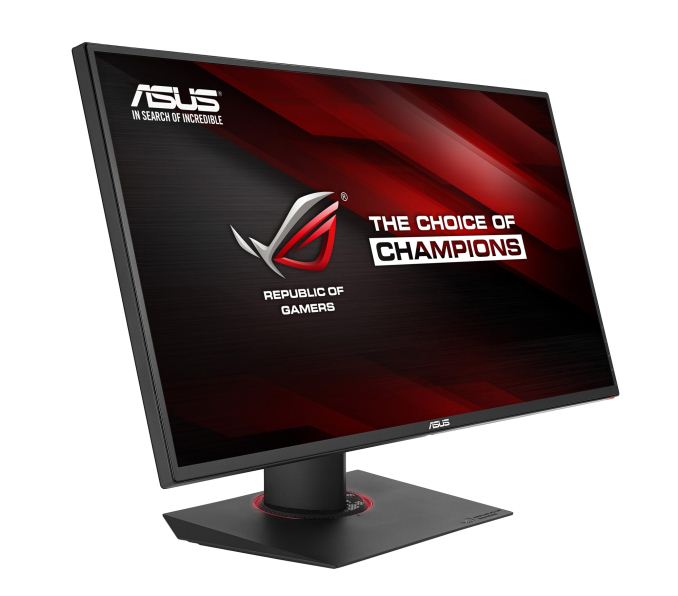
Aside from NVIDIA G-Sync, the PG278Q comes with a Turbo Key on the rear for quick selection between 60 Hz, 120 Hz and 144 Hz depending on user preference. The GamePlus hotkey gives a crosshair overlay to enhance the gaming environment (useful in games that do not offer steady central crosshairs), as well as timer functions. The OSD is navigated by a joystick-like nub behind the side of the monitor.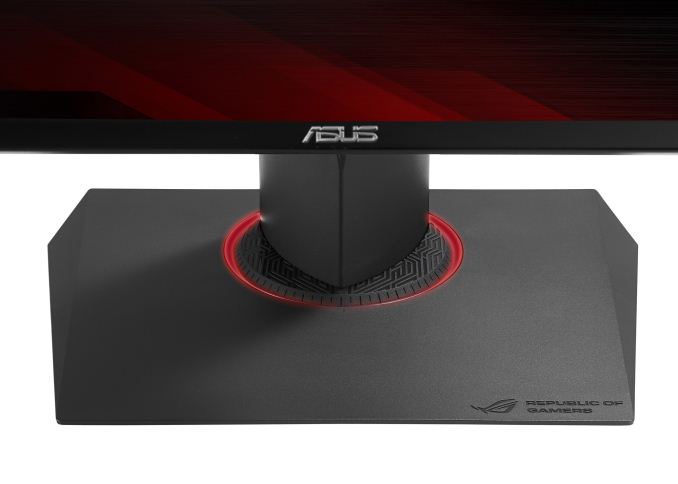
Response time is listed as 1ms GTG, with 16.7M colors and 160-170º viewing angles. Connectivity is via DisplayPort 1.2 only, with a USB 3.0 pass-through hub also in the electronics. VESA support is for 100x100mm, and the monitor is listed at 7.0 kg (15.4 lbs). The PR gives a bezel dimension of 6 mm.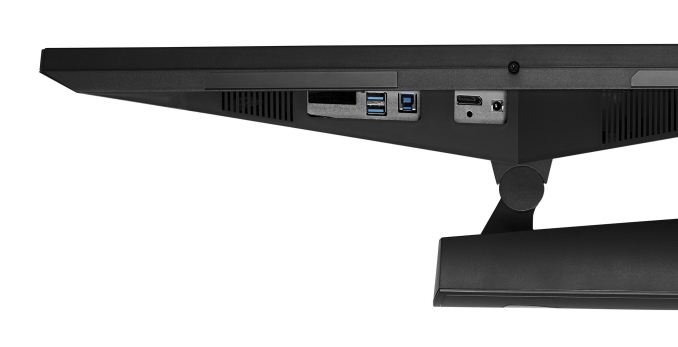
Due to the high refresh rate and inclusion of G-Sync, the Swift comes in as one of the most expensive TN panels on the market. Pricing will start at $799, varying by region, and the monitor should be available in Taiwan, APAC and EU today, with China in mid-August and North America by the end of August.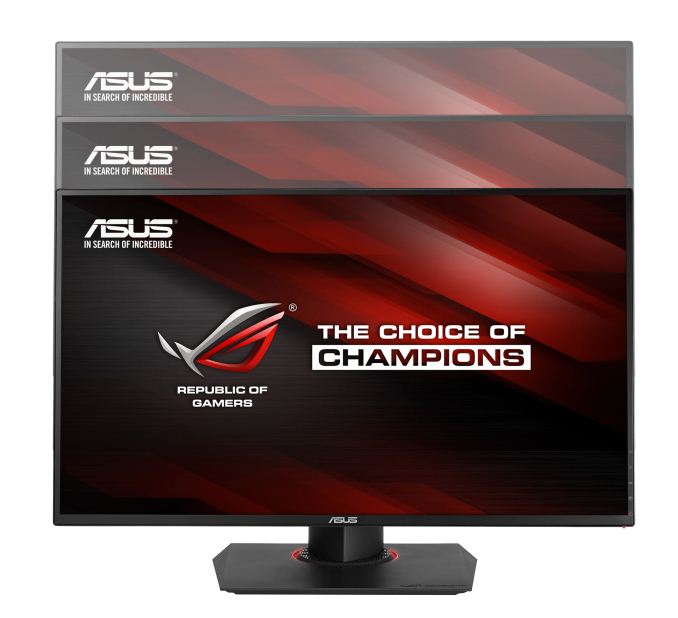
Gallery: ASUS ROG Swift PG278Q Monitor Released in APAC/EU, North America Coming SeptemberASUS ROG Swift PG278Q Display 27-inch (68.5cm) widescreen with 16:9 aspect ratio Resolution 2D mode: 2560 x 1440 (up to 144 Hz)
3D mode: 2560 x 1440 (up to 120 Hz)
2D/3D surround: 7680 x 1440 (2D up to 144 Hz / 3D up to 120 Hz)Pixel pitch 0.233mm / 109 PPI Colors (max) 16.7M Viewing angles 170-degree (H) / 160-degree (V) Brightness (max) 350cd/m² Response time 1ms (GTG) ASUS-exclusive
technologiesASUS GamePlus Technology (Crosshair / Timer)
ASUS Refresh Rate Turbo Key (60 Hz /120 Hz/ 144Hz Overclocking)
ASUS 5-way OSD Navigation JoystickNVIDIA®
technologiesNVIDIA® G-SYNC™ Technology
NVIDIA® 3D Vision™ Ready
NVIDIA® Ultra Low Motion Blur TechnologyInput/output 1 x DisplayPort 1.2
2 x USB 3.0 (Upstream x 1, Downstream x 2)Stand Tilt: +20°~-5°, Swivel: ±60°, Pivot: 90° clockwise
Height adjustment: 0~120mm
VESA wall mount: 100 x 100mmSize 619.7 x 362.96 x 65.98mm Weight (est.) 7.0kg 

Source: ASUS
More...
-
07-24-14, 08:00 AM #4120
Anandtech: Seagate NAS 4-Bay with Marvell ARMADA 370 Review
Seagate recently rebooted their NAS offerings, completely revamping their 2013 Business Storage lineup and dropping the old software platform altogether. In its place, they adopted the Debian-based NAS OS, development of which was started by LaCie prior to their acquisition by Seagate. In their 2014 lineup, Seagate has two classes of products, the NAS and the NAS Pro. While the former is suitable for workgroups of 1 to 25 clients, the Pro version pushes that up to 50. Read on for results from our evaluation of the 4-bay NAS offering.
More...


 Quote
QuoteThread Information
Users Browsing this Thread
There are currently 10 users browsing this thread. (0 members and 10 guests)


Bookmarks