

Results 5,181 to 5,190 of 12096
Thread: Anandtech News
-
07-20-15, 04:00 PM #5181
Anandtech: Samsung Releases PM863 & SM863 Enterprise SATA SSDs: Up to 3.84TB with 3D
At CES, Samsung displayed a variety of new SSD solutions, including PM863 and SM863, the company's new SATA 6Gbps enterprise drives. At the time Samsung was only sampling its key OEM customers, but with today's announcement Samsung is making the drives available through its retail channel in early August.
The PM863 and SM863 are based on Samsung's in-house "Mercury" controller, but unfortunately I don't have any additional details on the controller architecture itself. I'm guessing it's a derivative of the client-grade controllers utilizing ARM Cortex R4, but I'll have to wait for Samsung's reply before I know for sure.
The PM863 is the successor to Samsung's 845DC EVO line and makes the switch to more durable and performant 3D V-NAND. As you will find out in our tomorrow's Micron M510DC review, the 845DC is actually a very good and consistent drive despite using TLC NAND, so I'm very intrigued to see how Samsung has been able to improve performance with V-NAND. At least random write performance sees a good 40-50% upgrade and the endurance is now ~1.3 drive writes per day, whereas the 845DC EVO offered only 0.35 DWPD.Samsung PM863 Specifications Capacity 120GB 240GB 480GB 960GB 1.92TB 3.84TB Controller Samsung "Mercury" NAND Samsung 32-layer 128Gbit TLC V-NAND Sequential Read 380MB/s 520MB/s 525MB/s 520MB/s 510MB/s 540MB/s Sequential Write 125MB/s 245MB/s 460MB/s 475MB/s 475MB/s 480MB/s 4KB Random Read 86K IOPS 99K IOPS 99K IOPS 99K IOPS 99K IOPS 99K IOPS 4KB Random Write 5K IOPS 10K IOPS 17K IOPS 18K IOPS 18K IOPS 18K IOPS Read Power 2.4W 2.7W 2.9W 2.9W 3.0W 3.0W Write Power 2.1W 2.7W 3.8W 3.8W 4.0W 4.1W Endurance 170TB 350TB 700TB 1,400TB 2,800TB 5,600TB MSRP $125 $160 $290 $550 $1100 $2200 Warranty Three years
In addition to V-NAND, the other major upgrade in the PM863 is the addition of 1.92TB and 3.84TB capacities. Higher capacities allow for further cost savings by reducing the number of racks needed to achieve a specific capacity and in terms of drive prices alone the higher capacities offer more competitive cost per gigabyte. 4TB-class SSD itself isn't record breaking as SanDisk has been selling its Optimus Max for quite some time already, but the PM863 is a 2.5" 7mm product built on a single PCB, whereas SanDisk's is 15mm thick and needs multiple PCBs, giving Samsung a substantial cost advantage.
Whereas the PM863 succeeds the 845DC EVO, the SM863 is here to supersede the high-end PRO version. The 845DC PRO already made the switch to 3D V-NAND, but the SM863 upgrades the NAND from the first generation 24-layer to the latest 32-layer design for increased cost efficiency. I'm suspecting this is the same 86Gbit die that's used in the 850 PRO, but the 2TB 850 PRO appears to use a new 128Gbit die, so at this point I'm unsure about the exact NAND used in the SM863. I'll keep pinging Samsung for an answer, though.Samsung SM863 Specifications Capacity 120GB 240GB 480GB 960GB 1.92TB Controller Samsung "Mercury" NAND Samsung 32-layer MLC V-NAND Sequential Read 500MB/s 520MB/s 520MB/s 520MB/s 520MB/s Sequential Write 460MB/s 485MB/s 485MB/s 485MB/s 485MB/s 4KB Random Read 97K IOPS 97K IOPS 97K IOPS 97K IOPS 97K IOPS 4KB Random Write 12K IOPS 20K IOPS 26K IOPS 28K IOPS 29K IOPS Read Power 2.2W 2.2W 2.2W 2.2W 2.4W Write Power 2.5W 2.7W 2.8W 2.9W 3.1W Endurance 770TB 1,540TB 3,080TB 6,160TB 12,320TB MSRP $140 $180 $330 $870 $1260 Warranty Five years
The SM863 actually provides lower random write performance than the 845DC PRO, which is due to the reduced default over-provisioning as the SM863 only has 12% compared to 28% in the 845DC PRO. That said, the over-provisioning is user-configurable (Samsung even mentions that in the press release), so applications that require higher random write performance may increase the over-provisioning for higher performance. Endurance wise the SM863 is rated at about 3.5 DWPD for five years, which is again less than the 845DC PRO's 10 DWPD but additional over-provisioning will increase that.
Due to the more durable MLC V-NAND, the SM863 is mostly aimed for write-intensive applications that includes use cases such as online transaction processing (OLTP) and financial services, whereas the PM863 is targeted at read and mixed IO workloads, such as media streaming. Both feature tantalum capacitors for full power loss protection and support end-to-end data protection. The pricing of both drives seems fairly competitive because the PM863 only carries a ~10% premium over the 850 PRO, and the SM863 carries another 10% premium over the PM863. We look forward to getting the new drives in for review and putting them through our new 2015 Enterprise SSD Suite, so stay tuned!
More...
-
07-20-15, 05:00 PM #5182
Anandtech: AMD Launches the A8-7670K: Filling in the Gaps
AMD and Intel, in the last few years, have taken different approaches to how many CPUs enter the mainstream line of the market. Intel has historically had a large product stack, with processors at almost every frequency varying by 100 MHz and slowly rising in core count as well as cache and integrated graphics. AMD’s approach on the other hand is to release a handful of new models every quarter, initially covering the bases on day one and slowing updating the mid points (as well as new high end models) as a lithography node improves in yield and performance and the design matures. We recently took a look at the last launch, the AMD A10-7870K, as well as one at the beginning of the year in the shape of the A8-7650K. The A10-7870K was the first in a line known as the Kaveri Refresh models, or as per AMD’s internal codename ‘Godavari’. The A8-7670K is the second iteration of this line.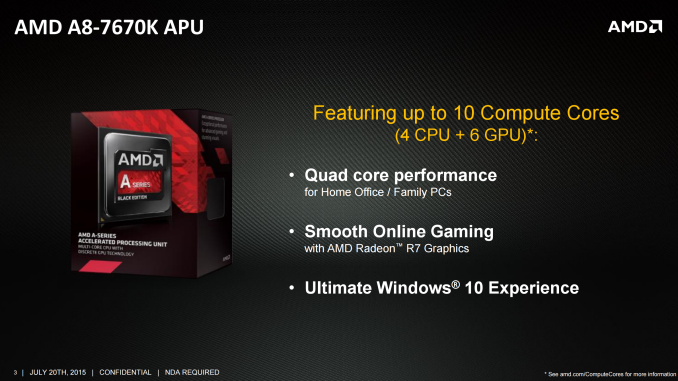
The Kaveri Refresh line, or so we are told, is a result of an improved production methodology for better frequency/voltage characteristics and better binning. In the case of the A10-7870K, we were told that the CPU has a minor +0.05 volt increase in the average stock voltage to account for the extra frequency, but due to the improvements the TDP remained the same (95W). In this circumstance, AMD improves on the A8-7650K with an extra 300 MHz to the base frequency (usually the main TDP killer) and an extra 100 MHz on the turbo. This is combined with a 37 MHz increase in the graphics side of the equation, again within the same TDP.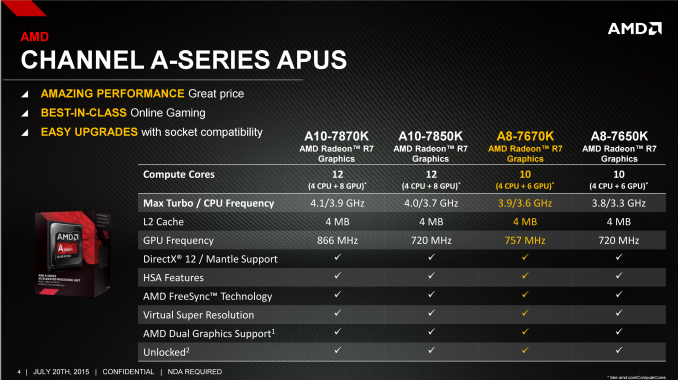
We covered a lot in the A10-7870K review which also applies here to the A8-7670K, although the A8 follows the other A8 APUs by having six compute units for the graphics, or 384 SPs. As AMD does not have a new mainstream desktop APU launch for Windows 10, the current stack of Kaveri and Kaveri Refresh APUs are going to be the focus for AMD, especially with back-to-school sales late in the summer. As a result, a good portion of the press release for the A8-7670K revolves around the use of AMD’s GCN architecture and its alignment to AMD’s mainstream graphics cards, allowing any software that is accelerated by one to be accelerated by the other. As shown above, this includes video playback, DirectX 12, accelerated video encoding and streaming as well.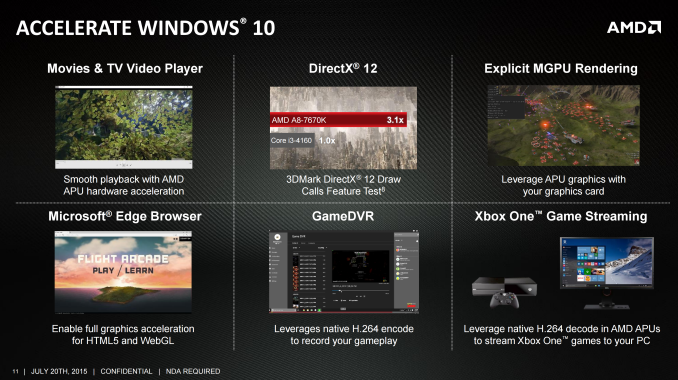
AMD’s marketing slides position the A8-7670K at $118 MSRP against the i3-4160 at $120 – and as a result we see benchmarks that require four full INT cores (7-zip), or those that rely on the GPU for part of their compute (PCMark 8), coming ahead. When compared to a discrete GPU solution, AMD suggests that an equivalent cost to the A8 is an Intel Pentium G3258 with a GT 730 discrete card, where the discrete card loses in popular eSports gaming titles. As has been the case for AMD, they play to the strengths of their product, and these lie in that sub-$700 gaming PC (based on the A68H platform) built for eSports that should also help with future DirectX 12 multi-GPU rendered titles.AMD Kaveri Lineup A10-
7870KA10-
7850KA10-
7800A10-
7700KA8-
7670KA8-
7650KA8-
7600X4
860KPrice $137 $134 $131 $120 $118 $104 $89 $85 Modules 2 2 2 2 2 2 2 2 Threads 4 4 4 4 4 4 4 4 Core Freq. (GHz) 3.9-4.1 3.7-4.0 3.5-3.9 3.4-3.8 3.6-3.9 3.3-3.8 3.1-3.8 3.7-4.0 Compute Units 4+8 4+8 4+8 4+6 4+6 4+6 4+6 4+0 Streaming
Processors512 512 512 384 384 384 384 N/A IGP Freq. (MHz) 866 720 720 720 754 720 720 N/A TDP 95W 95W 65W 95W 95W 95W 65W 95W DRAM
Frequency2133 2133 2133 2133 2133 2133 2133 1866 L2 Cache 2x2MB 2x2MB 2x2MB 2x2MB 2x2MB 2x2MB 2x2MB 2x2MB
The AMD A8-7670K is officially launched today and currently retails at $110 on Newegg, making it cheaper than the official MSRP. If we get a sample in, we’ll write a review and add the data to our processor comparison database Bench.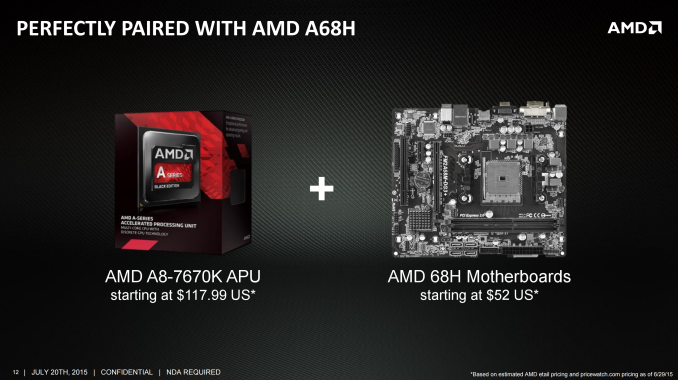
Source: AMD
More...
-
07-20-15, 06:01 PM #5183
Anandtech: ASUS Releases Convertible ChromeBook Flip C100
Today ASUS is launching a new Chromebook, but this one gets the flip treatment with a 360° hinge. According to ASUS, it brings together the experiences of a tablet and notebook into one device. We’ve certainly seen a lot of these on the Windows side, but for a device packing Chrome OS, this is certainly less common if not unique.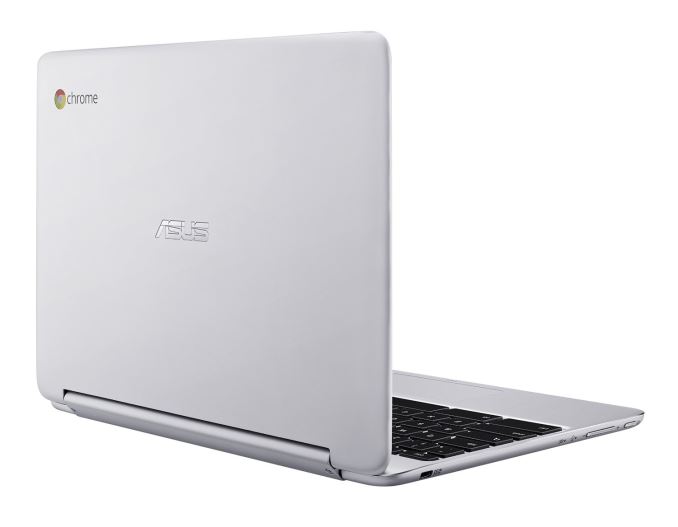
Let’s go over what is inside. ASUS turned to Rockchip for the processor on this device with the Rockchip 3288-C SoC inside. This is a quad-core design based on the Cortex A17, and clocks in at 1.8 GHz. The GPU is the ARM Mail T624, and you can get either 2 or 4 GB of system memory and 16 GB of eMMC storage. It also supports a SD/SDXC card reader if you need to add a bit more storage.
Although the internals are certainly low end, ASUS did put a multi-touch IPS display in, albeit at only 1280x800 resolution, but for the 10.1” low cost device, that is likely serviceable. There are also outputs for HDMI if necessary and of course a headset jack. There are two USB 2.0 ports for connectivity, and the battery is rated for up to nine hours.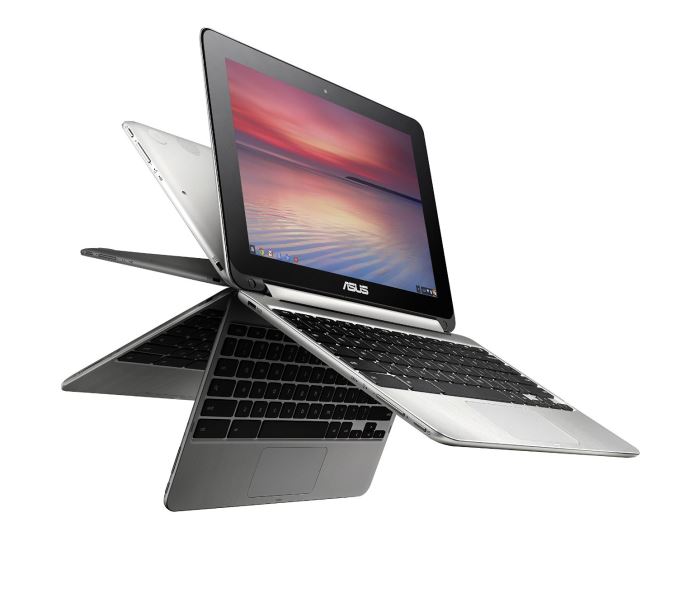
The keyboard is 97% of a full-sized notebook keyboard, so despite the small size it should be reasonable to type on.ASUS ChromeBook Flip C100 Processor Rockchip 3288-C
Quad-core Cortex A17 @ 1.8 GHz
ARM MAli T624 GPUConnectivity 802.11ac
Bluetooth 4.1Memory 2G or 4GB DDR3L Storage 16GB eMMC Battery 2-cell up to 9 hours I/O 2 x USB 2.0
HD webcam
micro HDMI
Headphone/mic jack
SD Card readerDimensions 10.35" x 7.18" x 0.6" / 263 x 182 x 15.2 mm Display 10.1" 1280x800 IPS LCD with capacitive touch Weight 1.96 lbs / 0.89 kg Price $249/$299 for 2GB/4GB
Speaking of size, the 0.6-inch body weighs in at just under two pounds, so it should be easy to tote around. That’s nothing like what an actual tablet weighs of course, but for a small notebook it is very light.
My biggest concern with the ChromeBook Flip C100 is the operating system though. Windows devices have been sporting these convertible designs for some time, but Windows 8 was built with touch as a primary input device, and although the Windows store is not as fleshed out as the iOS tablet store, it is certainly more fleshed out that Chrome OS as a tablet OS.
Gallery: ASUS Flip C100


If you are interested in kicking the tires on one of these, they are available now from the ASUS eStore, Newegg.com, and Amazon.com for $249 (2GB) or $299 (4GB).
Source: ASUS
More...
-
07-21-15, 07:30 AM #5184
Anandtech: Micron M510DC (480GB) Enterprise SATA SSD Review
Most data center workloads tend to be read-intensive. It's only recently that SSDs have started to offer pricing low enough to replace hard drives in read workoads and a key factor in that has been the introduction of smaller and smaller NAND lithographies. With the M510DC, Micron is taking its proven M500DC platform and accompanying it with its latest 16nm 128Gbit MLC NAND to target the read-centric workloads with lower endurance needs. The M510DC review is also the introduction to our new 2015 Enterprise SSD Suite, so read on to see what we've been working on for the past few months!
More...
-
07-21-15, 03:00 PM #5185
Anandtech: Examining Microsoft Edge Browser Performance
In what seems like forever ago, Microsoft’s Project Spartan was announced at the January 21st event in Redmond. This project kept the same rendering engine, Trident, and ECMAScript (JavaScript) engine, Chakra, as Internet Explorer, but stripped out much of the old code for backwards compatibility and moved forward with a push towards better performance and web standards support. I took a look at the performance of Project Spartan back in January when it could be enabled inside of Internet Explorer. The performance jump from Internet Explorer was extremely large, which was a good indication of what was to come.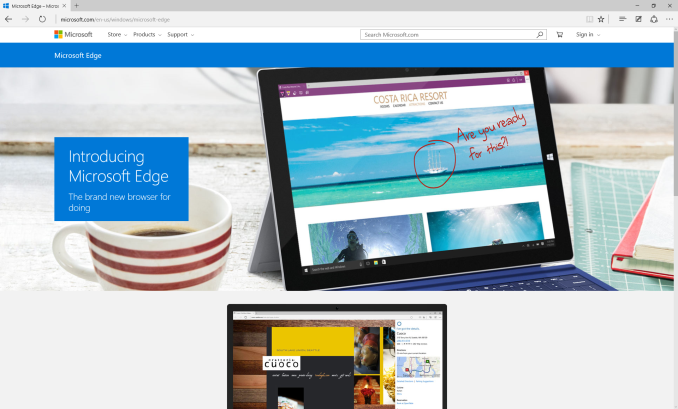
Moving forward, Project Spartan got a name in Microsoft Edge back at Build. Over the last several months, Microsoft has put out quite a bit of information on the new features they are adding to Edge over on the Microsoft Edge Dev Blog including support for the latest ECMAScript standards, asm.js, SIMD support, and much more, all in an effort to bring their browser up to par for the modern web. It is likely not a surprise to many that Internet Explorer has had a tremendously long development cycle, especially compared to browsers like Chrome, and now Firefox, which are updated almost continuously. Some of that was due to the reliance of old features which were used in businesses, and Microsoft’s strong adoption in the enterprise has certainly held them back when it comes to large scale changes to the browser. Internet Explorer will be sticking around for those who need it (for example if you need ActiveX Controls on your page) but for the rest of Windows users, Microsoft Edge will now be the new default browser out of the box.
I’ve gone over some of this in the past, but it is likely worth a refresher anyway. Edge is bringing some new features such as integrated Cortana support built right into the browser to offer contextual search within a web page, or to offer answers to questions right in the address bar. It will also have support for annotation of web pages using a pen, mouse, or touch, and annotated pages can easily be shared. It has a reading view, a reading list, and while not available next week when Windows 10 ships, it will be gaining extension support very similar to Google Chrome to add even more functionality to the browser. This, combined with better web standards support, and a much quicker update cadence (this will have to be proven by Microsoft after release, but they have committed to quicker updates of Edge through the Windows Store) should result in a much better browsing experience than was available in Internet Explorer. If you have already switched from IE to Chrome, Firefox, or another browser, it may not be enough to sway you back – especially without extension support at launch – but it is at least worth a look. I’ll get more into my takes on Edge in our Windows 10 review.
For now, what we can examine is browser performance, not only because it is important, but because Microsoft has been making a lot of statements about improved performance of Edge as recently as last week when Windows 10 Build 10240 was released. When a company says a product is “blazing fast” it is a good idea to check it out to see if it actually lives up to that performance level.
Luckily I did run numbers in January on my desktop which features an Intel Core i7-860 processor. None of the hardware has changed, so I decided to re-run the tests with the latest version of all of the browsers. I kept the original numbers for IE 11, but I did re-run the tests to verify that they did not change.
In every single instance, Microsoft Edge outperformed Project Spartan from back in January which is a good sign. It is the quickest browser in Google’s Octane 2.0 benchmark, and by a good margin. It is still the slowest in WebXPRT 2013 though. One of the biggest improvements though was the WebGL performance in the Oort Online benchmark, which went from terrible to good.Browser Performance - Core i7-860 Benchmark IE 11 (Jan) Spartan (Jan) Edge 20 (July) Chrome 40 (Jan) Chrome 43 (July) Firefox 35 (Jan) Firefox 39 (July) Sunspider (lower is better) 149.7ms 144.6ms 133.4ms 260.9ms 247.5ms 220.1ms 234.6ms Octane 2.0 (higher is better) 9861 17928 22278 17474 19407 16508 19012 Kraken 1.1 (lower is better) 3781.2ms 2077.5ms 1797.9ms 1992.8ms 1618.7ms 1760.4ms 1645.5ms WebXPRT (higher is better) 913 1083 1132 1251 1443 1345 1529 Oort Online (higher is better) 1990 2170 5470 5370 7620 3900 7670* HTML5Test (higher is better) 339 344 402 511 526 449 467
The other browsers have not been sitting idle though, and in that time they have also made gains in their performance. But the story is still a good one for Edge. It really is right up there with the rest of the browsers in terms of performance. It is quicker in some workloads, and slower in others, but generally performance should not be an issue. It still falls behind in the HTML5 test, but it has made big improvements there as well.
One thing that did pop out though is how much of a gain Firefox made in the WebGL test. Firefox went from middle of the pack to leading in the overall score, but if you noticed in the table I had to put an asterisk beside its score. The performance was quite good, but it achieved this performance by not rendering the scene correctly at all which contributed to its high score. In Oort Online’s benchmark, there is a snow scene, which Firefox rendered as blinking lights, and a rain scene, which was rendered as a couple of horizontal lines as seen in this screenshot.
It is great to see Microsoft focusing on browser performance again, and especially not sitting idle since January, since the competition in this space has not been idle either. Only time will tell how Edge holds up over time, and if it continues to receive updates on a quicker cadence, but considering it is already at version 20.10240.16384.0, it does appear that Microsoft has jumped on the rapid release cycle with regards to their browser, which will only help them moving forward. Firefox Rain Rendering (Incorrect)
 Edge Rain Rendering (Correct)
More...
-
07-21-15, 06:00 PM #5186
Anandtech: Microsoft Reports FY 2015 And Q4 Results: Nokia Write Down Results In $3.2
Microsoft released their earnings report for Q4 of fiscal year 2015. The numbers certainly reflect the massive write down of the Nokia acquisition that CEO Satya Nadella announced earlier in the month. For the three months ending June 30 2015, Microsoft had $22.18 billion in revenue which is down 5.1% year-over-year. Gross margin for Q4 2015 was $14.7 billion, but thanks to $8.4 billion in impairment, integration, and restructuring costs, operating income was a $2.1 billion loss, which is down 131% as compared to Q4 2014. Despite the operating loss, Microsoft is still looking at $1.439 billion in taxes, so their net income for Q4 2015 is a loss of $3.195 billion. This results in a loss of $0.40 per share.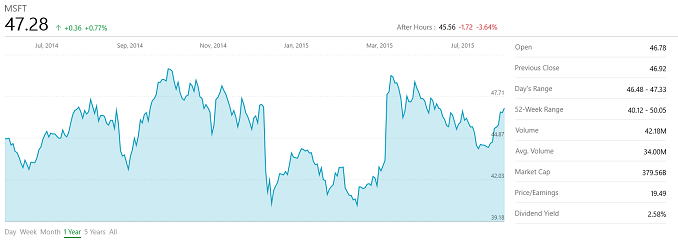
For the full fiscal year 2015, Microsoft had revenue of $93.6 billion which is up 7% over their 2014 numbers. However the cost of that revenue was up almost six billion, so their gross margin was almost flat at $60.5 billion. For the full fiscal year 2015, Microsoft incurred just over $10 billion in impairment, integration, and restructuring charges, with the majority being in Q4 with the Nokia write down, which gave them an operating income of $18.161 billion for the year, down from almost $28 billion a year ago. Net income came in at $12.2 billion for the year, down from $22.1 billion a year ago. Earnings per share for the full year were $1.48 per diluted share, down from $2.63 a year ago.
It is going to be difficult for any company to write down over $8 billion in a quarter and still turn a profit (Apple is the only exception right now in the tech industry) but that one time charge is now off the books and they can move into 2016 with a clean slate. There will likely be some more restructuring charges with the upcoming layoffs announced a couple of weeks ago, but that should impact financials too drastically for FY 2016.Microsoft Q4 2015 Financial Results (GAAP) Q4'2015 Q3'2015 Q4'2014 Revenue (in Billions USD) $22.180 $21.729 $23.382 Operating Income (in Billions USD) -$2.053 $6.594 $6.482 Gross Margin (in Billions USD) $14.712 $14.568 $15.749 Margins 66.3% 67% 67.4% Net Income (in Billions USD) -$3.195 $4.985 $4.612 Basic Earnings per Share (in USD) -$0.40 $0.61 $0.55
Microsoft reports its income in two over-arching units with Devices and Consumer being the one focused towards end users, and Commercial which is targeted to business and enterprise customers. Each is further broken down into various subgroups which we can take a look at in depth.
For Devices and Consumers (D&C), revenue declined 13% to $8.7 billion for the quarter. The biggest hit to the bottom line was in the D&C Licensing, with Windows OEM revenue dropping 22% following the end of the Windows XP refresh cycle. Unit inventory is also being managed ahead of the Windows 10 launch. Windows Phone licensing revenue was down 68%, but that is compared to Q4 2014 where there was a recognition of $382 million from the conclusion of the commercial agreement with Nokia, and Windows Phone revenue has taken a bit of a nosedive since it was made free to all OEMs, and with Microsoft obviously not charging itself when selling Lumia handsets. The final piece of D&C Licensing is Office Consumer, which is the full license for Office, and it is down 42% year-over-year. Japan’s PC market contributed to 19 pts of revenue decline itself, and an additional 13 pts of decline were attributed to customers moving to Office 365, which falls under D&C Other.
D&C Computing and Gaming Hardware had a strong quarter, up 44% to $1.93 billion in revenue. Surface has continued its strong growth, with revenue of $888 million, which is up 117% year-over-year. For FY 2015, Surface had $3.6 billion in revenue, up 65% from FY 2014. Xbox sales also grew 30% to 1.4 million units (this is Xbox One and Xbox 360) which is good growth, but they still have some work to do in order to get close to the PlayStation 4 numbers. Overall the D&C hardware side has made some big gains, with a gross margin of $435 million for the quarter, up 2316.7% from Q4 2014’s $18 million.
D&C Phone Hardware had more than 10% growth in Lumia sales, with 8.4 million Lumia handsets sold. The bad news is that revenue declined with the majority of the sales being in lower price point devices. That is hardly a surprise though since they have not released anything close to a high price point device in well over a year now. Microsoft is still selling Nokia feature phones, and somehow they still sold almost 20 million of those. Revenue was down 38% year-over-year to $1.23 billion, and gross margin for this division had a loss of $104 million, compared $54 million in the black a year ago. Losing money on every phone sold is not a great way of doing business, so you can certainly see why Satya Nadella make the decision to write down this acquisition and focus on less, but hopefully better, devices.
D&C Other is Microsoft’s consumer facing cloud services. This includes Bing, online advertising, Xbox Live, Office 365 Home and Personal, and first-party games. For Q4, this segment had $2.3 billion in revenue, up 31% from Q4 2014. Xbox Live sales grew 58%, online advertising revenue was up 21%, Bing US market share was up 110 basis points to 20.3%, first-party games was up 62% (mostly Minecraft), and Office 365 Consumer added almost three million customers in Q4, and is now up to 15.2 million. For the full FY 2015, Office 365 Consumer was up almost ten million subscribers. Gross margin for the division was 26% or $594 million, which is up 104% from Q4 2014.
The remainder of Microsoft’s earnings is from the Commercial segments, where they have historically made the bulk of their income with the higher margins of enterprise. For the quarter, commercial revenue was up just slightly to $13.53 billion, compared to $13.50 billion a year ago. Gross margin was down 1% to $10.88 billion. Commercial licensing revenue was down 7% for the quarter, with Office commercial down 18% due to customers moving to Office 365. Windows volume licensing revenue was down 8%, and server revenue was flat. Dynamics ERP customer adds grew 35% in the quarter. The Commercial Other segment includes Office 365 business plans, Azure, Enterprise Mobility and Dynamics CRM Online, and Other revenue grew 36% year-over-year. Commercial Cloud revenue was up 88% and now has an annualized revenue of over $8 billion. Azure revenue and compute usage had a big year, with both growing in the triple digits year-over-year. Microsoft’s CRM Online install base grew almost 250%, and Enterprise mobility added 90% more users, to over 17,000. Microsoft has been transitioning their services and software to the cloud for some time, and they have been seeing steady growth here.
Obviously it is a bit of a mixed bag for Q4 2015, and really for all of FY 2015, with the $8 billion or so write down of the Nokia acquisition. Microsoft posted Non-GAAP results to account for this, and without that huge hit, operating income would have been $6.4 billion. Microsoft returned $6.7 billion to shareholders, which is up 96%, with $4.2 billion of that being share repurchases and $2.5 billion paid out in dividends.Microsoft Q4 2015 Segment Overview (in Billions USD) Q4'2015 Q3'2015 Q4'2014 D&C Licensing Revenue $3.23 $3.48 $4.90 D&C Licensing Gross Margin $2.97 $3.21 $4.52 D&C Computing and Gaming Hardware Revenue $1.93 $1.80 $1.34 D&C Computing and Gaming Hardware Gross Margin $0.44 $0.41 $0.02 Phone Hardware Revenue $1.23 $1.40 $1.98 Phone Hardware Gross Margin -$0.104 -$0.061 $0.054 D&C Other Revenue $2.30 $2.28 $1.76 D&C Other Gross Margin $0.59 $0.57 $0.29 Commercial Revenue $13.53 $12.80 $13.50 Commercial Gross Margin $10.88 $10.42 $10.99
With Windows 10 right around the corner, we’ll have to see if that can help out on the D&C revenue which has been taking a beating with the reduction in sales of new PCs. With the free upgrade though, this may not make an impact immediately (if at all) so FY 2016 should be an interesting one to watch.
Source: Microsoft Investor Relations
More...
-
07-21-15, 07:01 PM #5187
Anandtech: Apple Reports Q3 FY 2015 Results: Record Results With Strong iPhone And Ma
Today Apple released their earnings for Q3 of fiscal year 2015, which ended June 27th. In what seems to be a never-ending sequence of records, once again, Apple posted a record third quarter. Revenue for the quarter came in at $49.6 billion, up 33% from a year ago. Gross margin was $19.7 billion, also up 33% from Q3 2014. Operating income was up almost 37% to $14.1 billion, and net income was $10.7 billion for the quarter, a gain of 37.8% year-over-year. Earnings per share was $1.85, up from $1.28 in Q3 2014.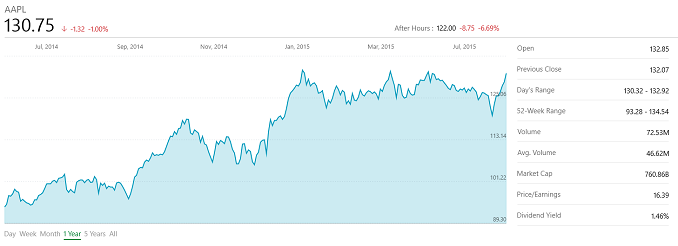
Apple’s iPhone business has been the primary factor in these record breaking quarters, and the iPhone 6 and 6+ sales continued to be strong. For the quarter, Apple sold 47.5 million iPhones, which is a gain of 35% in units. Even more impressive is that these 35% more units resulted in 59% more revenue, with iPhone sales totalling $31.4 billion for this quarter alone.Apple Q3 2015 Financial Results (GAAP) Q3'2015 Q2'2015 Q3'2014 Revenue (in Billions USD) $49.605 $58.010 $37.432 Operating Income (in Billions USD) $14.083 $18.278 $10.282 Gross Margin (in Billions USD) $19.681 $23.656 $14.735 Net Income (in Billions USD) $10.677 $13.569 $7.748 Margins 39.7% 40.8% 39.4% Earnings per Share (in USD) $1.85 $2.33 $1.28
Mac sales have also been strong, and while Apple has generally outpaced the PC market in sales growth for a while, Apple saw an additional 5% in Mac unit sales for Q4 compared to Q3, and 9% from a year ago. This is at a time where the rest of the PC market is contracting, so Mac sales were an impressive 4.8 million units, with revenue of just over $6 billion for the quarter. The resurgence of the Mac has been quite the rise, with Mac revenue being eclipsed quite a bit by the iPad not very long ago. Times have changed though and Apple’s PC business is currently the only one that has seen an increase in sales according to the reports floated around in the last couple of weeks.
iPad sales though are not so rosy. The iPad sales were very strong, and while sales are not exactly terrible, the number of units being sold has been dropping for some time. Much debate has been about why this is, but certainly owners of the iPad have not felt the need to refresh their devices anywhere nearly as quickly as phones. For the quarter, there were 10.9 million iPads sold, which resulted in revenue of $4.5 billion. The number of units sold is down 13% from Q2, and down 18% year-over year.
Services, which include iTunes sales, AppleCare, Apple Pay, and will include Apple Music in the future, saw a nice jump as well with just over $5 billion in revenue for the quarter. This is up 1% from last quarter, and up 12% from last year.Apple Q4 2014 Device Sales (thousands) Q3'2015 Q2'2015 Q3'2014 Seq Change Year/Year Change iPhone 47,534 61,170 35,203 -22% +59% iPad 10,931 12,623 13,276 -13% -18% Mac 4,796 4,563 4,413 +5% +9%
“Other Products” which is Apple TV, Apple Watch, Beats, iPods, and accessories had a big quarter, and while individual numbers were not announced, it is likely due to initial sales of the Apple Watch which came out in the quarter. For Q3, this group had sales of $2.6 billion, up 56% from last quarter and up 49% year-over-year. Likely most of the increase can be attributed to the Watch, but without knowing average selling price, it would be pretty difficult to try and extrapolate unit sales without more information.
This pipeline post is quite a bit shorter than the Microsoft earnings, but for all of the right reasons. There is less to say when things are going as well as they are for Apple right now. iPhone sales are still a huge part of their balance sheet, and seem to have no sign of slowing down. People obviously wanted a larger iPhone and sales have skyrocketed since the iPhone 6 and 6+ were launched. But I think we were all expecting this based on past performance. I think what is most interesting is how much of the PC market Apple has managed to chip away with Mac sales, which are up an amazing 9% when the rest of the market contracted.Apple Q2 2015 Revenue by Product (billions) Q3'2015 Q2'2015 Q3'2014 Revenue for current quarter iPhone $31.368 $40.282 $19.751 63.2% iPad $4.538 $5.428 $5.889 9.1% Mac $6.030 $5.615 $5.540 12.2% iTunes/Software/Services $5.028 $4.996 $4.485 10.1% Other Products $2.641 $1.689 $1.767 5.3%
For Q4, Apple is expecting revenue of $49 to $51 billion, with a gross margin of 38.5 to 39.5%.
Source: Apple Investor Relations
More...
-
07-22-15, 09:30 AM #5188
Anandtech: The ASUS TUF X99 Sabertooth Review
When a system builder has the opportunity to vary their design, a number of factors can come into play. Some want performance, aesthetics, low noise, small form factor, or a long term system. For that last one, ASUS offers the TUF range (The Ultimate Force) of motherboards with 5 year warranties and engineering to warrant it. Today we have the latest member of the group aimed at the high end platform for review, the ASUS TUF X99 Sabertooth.
More...
-
07-22-15, 06:30 PM #5189
Anandtech: Qualcomm Announces Major Workforce Restructuring With Q3 FY 2015 Results
At one point, it seemed like Qualcomm would become the ARM equivalent to Intel in the x86 space. Their Snapdragon processors, equipped with industry leading cellular technology, powered a huge number of devices. Practically every flagship phone (sans Apple of course) carried a Qualcomm processor inside. But even Intel makes some big missteps, and the Netburst era was certainly one, allowing AMD to provide a much better product. Unlike those days though, there are more than just two players in the ARM SoC space, and Qualcomm has been under some relentless competition (always the best kind) from Samsung at the high end with the Exynos 7420, and on the low end with companies like Mediatek and Rockchip going after the lower margin business.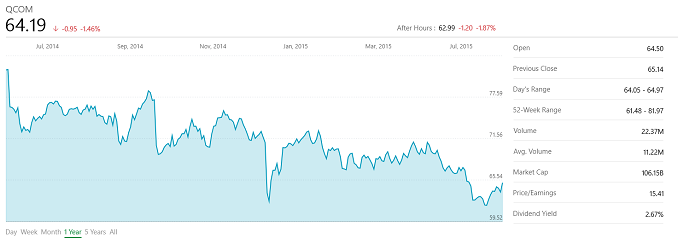
It’s not fair to blame all of Qualcomm’s woes on one issue, but Qualcomm’s issues began when Apple made the surprise move to 64-bit. On the 32-bit side, Qualcomm had been using custom designed ARM cores, with the last evolution of that being the Krait 450 core in the Snapdragon 805. Krait performed well, but with the move to 64-bit, suddenly the industry felt that the need to check the 64-bit box on the spec sheet in order to compete. Since Qualcomm was not ready with their 64-bit custom core, they had to turn to the standard ARM designs with the A53 and A57 powering their 64-bit lineup. As a result, this affected their market differentiation and performance at the high end.
Qualcomm will finally be moving to FinFET with the Snapdragon 820, and with it will be the custom Kyro 64-bit core. This should be available in the latter part of 2015, and available in devices in early 2016.
But that is the future, and today Qualcomm released their Q3 FY 2015 results. Revenue for the company was $5.8 billion, down 14% from the $6.8 billion a year ago. Operating income was down a staggering 40% to $1.2 billion, and net income was down 47% to $1.2 billion. Earnings per share fell 44% to $0.73, with Non-GAAP EPS of $0.99 which actually beat expectations slightly.
For a company which at one point seemed certain to become the dominate player in the ARM SoC space, these numbers hit pretty hard. Incorporated companies have a fiduciary duty to their shareholders, and Steve Mollenkoft, CEO of Qualcomm, today announced a major restructuring of the company which will see the company shed up to 15% of its workforce. It intends to save $1.1 billion annually through a series of targeted layoffs which will impact their temporary workforce, engineering, and reducing the number of offices. It is also reducing the annual share-based compensation by around $300 million. These cuts are expected to be complete by the end of fiscal year 2016, for a savings of $1.4 billion annually.Qualcomm Q3 2015 Financial Results (GAAP) Q3'2015 Q2'2015 Q3'2014 Sequential Change Year-Over-Year Change Revenue (in Billions USD) $5.8 $6.9 $6.8 -15% -14% Operating Income (in Billions USD) $1.2 $1.3 $2.1 -8% -40% Net Income (in Billions USD) $1.2 $1.2 $2.2 +12% -47% Earnings per Share (in USD) $0.73 $0.63 $1.31 +16% -44%
They will also be reviewing their corporate structure, capital return opportunities, and other alternatives with the goal of creating stockholder value. Qualcomm’s shares have fallen in price around 20% in the last year. They also have reaffirmed their commitment to return significant capital to shareholders, with a minimum of 75% of free cash flow being returned through dividends and share repurchases, in addition to the $10 billion stock repurchase program which was already underway. The board has also seen a shakeup, with two new members being added and they intend to appoint one additional independent director to the board. The company executives will also have additional return-based metrics for compensation.Qualcomm Q3 2015 Financial Results (Non-GAAP) Q3'2015 Q2'2015 Q3'2014 Sequential Change Year-Over-Year Change Revenue (in Billions USD) $5.8 $6.9 $6.8 -15% -14% Operating Income (in Billions USD) $1.7 $2.7 $2.4 -37% -30% Net Income (in Billions USD) $1.6 $2.3 $2.5 -31% -35% Earnings per Share (in USD) $0.99 $1.40 $1.44 -29% -31%
All seems pretty rough for Qualcomm, but in the end they were still profitable, although not as profitable as they would like to be. MSM chip shipments were actually flat year-over-year with 225 million SoCs shipped. The initial 64-bit era has not been overly kind to Qualcomm though, and with their custom core being around six months away still, they have some work to do in the interim to avoid a repeat with the next SoC refresh.
Source: Qualcomm Investor Relations
More...
-
07-23-15, 09:15 AM #5190
Anandtech: The 2TB Samsung 850 Pro & EVO SSD Review
For the past two years, client SSD capacities have been stumbling at 1TB. The cost of NAND is still too high to make terabyte drives a mainstream capacity, but the prices have fallen enough to create a market for multi-terabyte SSDs among enthusiasts and professionals. Samsung has historically held density records (e.g. 1TB mSATA) thanks to its advanced NAND and packaging technology and with the release of 2TB 850 Pro and EVO models Samsung is the first SSD manufacturer to enter the multi-terabyte era.
More...


 Quote
QuoteThread Information
Users Browsing this Thread
There are currently 19 users browsing this thread. (0 members and 19 guests)


Bookmarks